• Please use real names.

    Greetings to all who have registered to OPF and those guests taking a look around. Please use real names. Registrations with fictitious names will not be processed. REAL NAMES ONLY will be processed

    Firstname Lastname

    Register

    We are a courteous and supportive community. No need to hide behind an alia. If you have a genuine need for privacy/secrecy then let me know!
  • Welcome to the new site. Here's a thread about the update where you can post your feedback, ask questions or spot those nasty bugs!

The subjective quality factor (SQF)

Doug Kerr

Well-known member
I continue to be fascinated by a single-valued metric for the overall "sharpness" of an image, as it will be perceived perceived by a human viewer, called the Subjective Quality Factor (SQF).
There is a closely-related metric called acutance (a word that essentially means "sharpness").​
This metric is reported by some testing "agencies" in their reviews of cameras.

A nice discussion of this matter is here:

http://www.imatest.com/docs/sqf/#csf

To understand the principle of this metric, we need to recognize that the human visual system has a differing sensitivity to contrast at different angular frequencies (for the moment, consider these to be essentially like spatial frequencies). The recognized curve of this variation (for typical human viewers) is called the Contrast Sensitivity Function (CSF). It is essentially the MTF of the human visual system (not just to the optical image on the retina, but beyond, to the "perception" of that image).

To reckon the SQF of an imaging system (lets say of a camera), we take the MTF of the system (to the digital output) and multiply it at each spatial frequency by the value of the CSF at that frequency. We can crudely think of this as the MTF of the entire system, through to the human perception of the image. Or we can think of it as the MTF of the system weighted by the eye's varying sensitivity to contrast at each spatial frequency.

We then take the area under this "end-to-end MTF" curve. That (appropriately scaled) is the SQF of the camera.

But there is of course a complication. The MTF of the camera is based on spatial frequency (for example, at the focal plane, or if we wish, as projected onto a print or display image of some arbitrary size) whereas the CSF is in angular frequency terms.

Thus, to make the determination of SQF, we must contemplate some particular sized image in angular terms; that is, some particular image size to be viewed from some particular distance. Then there is a relationship between spatial frequency at the focal plane and angular frequency to the eye.

Of course, we may say, "well, we are trying to get a metric of how well the camera does, so we should not have to contemplate a particular viewing situation".

But, like it or not, if we decide to judge the camera based on how well does it do for the human eye, we have no choice but to contemplate the context in which the human eye will receive the image.

There is no doubt that this troublesome wrinkle is in part responsible for the limited interest in the SQF metric. We want a numerical answer to the question "how good was Marilyn Monroe", without the burden of considering, "at what?").

I would be interested to hear of any experience other members have had with considering the SQF ratings of cameras and whether they useful in predicting performance as adjudged by viewers.

Best regards,

Doug
 

Doug Kerr

Well-known member
I should perhaps point out that there is a simpler definition of SQF (in fact, this was the premise of Granger's original paper on the SQF).

Here, rather than weighting the system MTF by the eye's CSF and then integrating the resulting curve (which is what taking the area under it is), we just take the area under the system MTF between the spatial frequencies that correspond (based on our assumption about viewing conditions) to the range of angular frequencies from 3 to 12 cy/degree.

This is equivalent to using the more complete concept I described but replacing the actual CSF with one that is constant from 3 to 12 cy/degree and zero elsewhere. In other words, we consider that the eye is only responsive to contract over that range of angular frequency, and consistently over it.

I have not followed in the literature opinions of whether this simplified version has any significantly poorer correlation with "perceived" sharpness than the more complicated version.

There is an interesting discussion of this matter here:

http://www.bobatkins.com/photography/technical/mtf/mtf4.html

In that article, Atkins says:

Interestingly, in the 1980s a Swedish research group showed that subjective image quality could even be predicted from a simpler method that looked only at the MTF at a single spatial frequency rather than over a range of spatial frequencies as Grainger’s [sic] model does.​

I do not have the Swedish study mentioned by Atkins*, but from a credible-sounding interpretation of its principal finding in another forum I conclude that its punch line is that:

The system MTF at the frequency which, as reckoned from the eye in the assumed viewing situation, corresponds to about 3.5 cy/degree is by itself a good indicator of perceived image quality.

*“Lens performance assessment by image quality criteria”, K. Biedermann and Y. Feng, Image Quality: An Overview, Proc. SPIE Vol. 549, pp36-43 (1985)​

Very interesting.

I will try and work up a way to relate that to actual photographic situations.

But I think just now I will take a nap.

Best regards,

Doug
 

Doug Kerr

Well-known member
Well, actually I didn't take a nap. I had lunch instead.

The simplified definition of the metric "SQF" essentially is based on the average of the MTF of the camera system over the range of spatial frequencies that correspond to angular frequencies (from the viewpoint of the eye) running from 3 to 12 cy/degree.

How does this relate to the spatial frequencies in whose terms we usually think? Well, of course, to figure that, we must make an assumption about the viewing situation.

I will assume the following:

• Image size (on the focal plane): 36 mm × 24 mm

• Viewed image (print) size: 12 in × 8 in

• Viewing distance: 16 in.

Then, the range of spatial frequencies on the focal plane that corresponds to the range of angular frequencies at the eye from 3 to 12 cy/degree is about 3.7 to 14.7 cy/mm.

Normalized to picture height (as we often do), this corresponds to about 94-350 cy/mm (or 94-350 line pairs/picture height, if you prefer to think of it that way).

These are startlingly small values.

Now, evidently, from what I make of a summary quotation from the "Swedish" report by Jed Freudenthal on the APUG (Analog Photography User's Group) [see below], the camera MTF at a spatial frequency corresponding to an angular frequency at the eye of about 14 cy/degree has been found to be a very good indicator of perceived image quality (this is like the simplified SQF metric simplified even further).

In our assumed situation, this corresponds to a spatial frequency on the sensor of about 17 cy/mm, or about 410 cy/picture height.

This is to me a startling result! After all, we are normally speaking of a "resolution" for our 36 mm × 24 mm sensor camera of perhaps 2500 cycles per picture height.

Of course, no doubt the result from the "Swedish" report assumes some "reasonable" shape of the MTF curve. Clearly a camera with an MTF that is high at 410 cy/PH but then drops precipitously above that will not deserve the high quality score that the MTF at 410 cy/PH would suggest.

But perhaps we can realize that the value of an MTF that, for example, is at least 50% at some high spatial frequency (which we often use as our indicator of camera "resolution") is that it will usually be accompanied by an MTF that is high at the (much lower) "critical" frequency - which is what really counts!

Here is Jed Freudenthal's discussion (blue highlighting mine):

In the Swedish report is a plot between the critical spatial frequency and the perceived image quality (figure 3) and I quote their english comment : ' From this plot it is evident, that in viewing a picture from a distance of 40 cm, The MTF at 2 c/mm has very strong correlation with perceived image sharpness'. The report shows that the value of the MTF is scene dependent ( a landscape has to be detailed, a portrait not; the MTF of a portrait lens should be low; the MTF for landscapes high). However, all scenes will peak at the 2 c/mm.

In the Swedish report, you will find also a comparison between their study and the study of the Kodak research lab . These studies are in excellent agreement ( The Kodak research group used a range of spatial frequencies, covering most of the MTF of the human eye).


The 2 cy/mm value at a distance of 40 cm is the "critical frequency" value I started with, converting it as required (for example, to 14 cy/degree at the eye).

The passage I highlighted in blue is also especially fascinating.

All very interesting.

Best regards,

Doug
 

Doug Kerr

Well-known member
In the above I had described the original Granger SQF as being proportional to the area under the system MTF curve between the angular frequencies of 3 cy/deg and 12 cy/deg.

This is true but in particular applies to a plot of the MTF with a logarithmic axis of equivalent angular frequency.

For the more complicated form (MTF weighed by the CSF), the frequency axes for both MTF (angular frequency equivalent) and CSF are also logarithmic.

I should perhaps also mention that the scaling for SQF is such that (for either the simpler or CSF-weighted form), for an MTF whose value was 1.0 (100%) at every frequency (every frequency in the "window", for the simpler form), the SQF would be 100%.

Best regards,

Doug
 

Doug Kerr

Well-known member
In the above notes, I referred extensively to the Contrast Sensitivity Function (CSF) of the human eye. This is, in a certain sense, a sort of MTF of the eye. It shows that the eye is differently sensitive to luminance changes ("contrast") for different spatial frequencies (on the retina). But this can also be expressed not in terms of linear spatial frequency on the retina but rather angular spatial frequency (from the perspective of the eye as if it were a "black box").

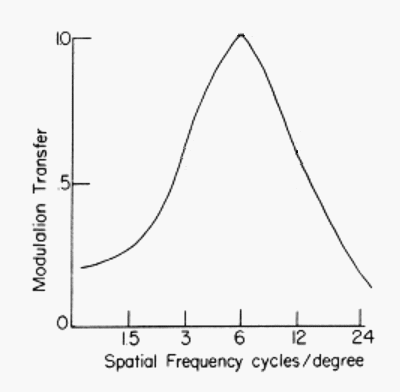
Here is a portrayal of the eye's CSF taken from a figure by Bob Atkins from his excellent tutorials on the matter of SQF:

CSF-02.gif


Contrast Sensitivity Function (CSF) of the human eye
(Adapted from a figure by Bob Atkins)​

Note that here the angular spatial frequency scale here is logarithmic. We will see shortly why that is.

Granger, in his work that led to the concept of the SQF, demonstrated that if we take the MTF of an optical system (converted to a function of equivalent angular spatial frequency) and multiply it by the eye's CSF , then (using a logarithmic scale of frequency) take the average of the result (by taking the area under the resulting curve, which corresponds to integration of the resulting function), that value is an excellent indicator of how the "quality" (in the sense of "sharpness") of the image the system will produce will be rated by a human observer.

But, with the limited computer resources of the time, doing that integration would be difficult in a context for practical use in photography. Granger found that an almost identical result could be obtained with a simpler algorithm: determining the average of the system MTF (again based on a logarithmic scale of angular spatial frequency) over only the range from 3 to 12 cycles/degree.

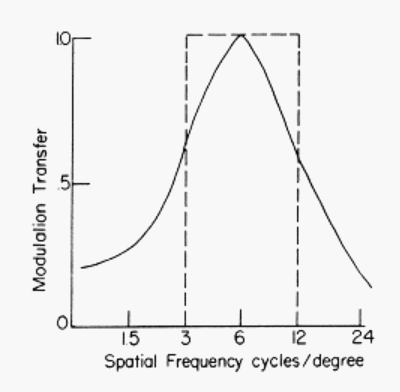
We can relate that to the "precise" Granger algorithm with this figure:

CSF-01.gif


Contrast Sensitivity Function (CSF) of the human eye
and its approximation
(Figure by Bob Atkins)​

If we followed the strict Granger algorithm but, instead of multiplying the MTF by the CSF curve, we multiplied it by the dashed curve in this figure, the result would be exactly that of the "simplified" Granger algorithm.

Best regards,

Doug
 

Doug Kerr

Well-known member
It is often considered that the "resolution" of the human eye is about 30 cy/degree.

It is interesting that the eye's CSF has such a low value at that frequency.

Best regards,

Doug
 
It is often considered that the "resolution" of the human eye is about 30 cy/degree.

It is interesting that the eye's CSF has such a low value at that frequency.

Best regards,

Doug

Excellent article Doug.

I can confirm by experience that a good eye resolving 30cy/degree does so at the very limits of contrast perception. I've watched many beginning amateur astronomers fail to see detail on tiny planetary discs in their telescope eyepieces. Then as experience accumulates the detail that has always been there, but at very low contrast, becomes more and more obvious. It's as if the mind learns how to turn up the micro-contrast.
 

Doug Kerr

Well-known member
Hi, Maris,

Excellent article Doug.
Thank you. It is neat stuff!

I can confirm by experience that a good eye resolving 30cy/degree does so at the very limits of contrast perception.
Thanks for that data point. It fits well with the CSF seen in that figure.

I've watched many beginning amateur astronomers fail to see detail on tiny planetary discs in their telescope eyepieces. Then as experience accumulates the detail that has always been there, but at very low contrast, becomes more and more obvious. It's as if the mind learns how to turn up the micro-contrast.

That is a great observation.

Yes, we have a wondrous system at our disposal, don't we! It is so - heuristic!

Thanks again for your input.

Best regards,

Doug
 
It is often considered that the "resolution" of the human eye is about 30 cy/degree.

It is interesting that the eye's CSF has such a low value at that frequency.

Hi Doug,

But that low contrast sensitivity at that frequency is exactly why it is approximately a limit to visual acuity. Even higher spatial frequencies will appear to have virtually zero contrast to our eyes, and are therefore no longer resolved.

Cheers,
Bart
 

Doug Kerr

Well-known member
Hi, Bart,

But that low contrast sensitivity at that frequency is exactly why it is approximately a limit to visual acuity. Even higher spatial frequencies will appear to have virtually zero contrast to our eyes, and are therefore no longer resolved.
Sure, that makes sense.

But how do we reconcile that with the fact that we often consider the resolution of a camera to be the frequency where the MTF is still substantial (e.g., 50%).

Obviously these two notions are not directly comparable.

Thanks.

Best regards,

Doug
 
Hi, Bart,


Sure, that makes sense.

But how do we reconcile that with the fact that we often consider the resolution of a camera to be the frequency where the MTF is still substantial (e.g., 50%).

Hi Doug,

In my opinion, the MTF50 metric is nothing more than an indicator of overall quality, not an indicator of resolution. That recognizes that the CSF favors lower spatial frequencies rather than those at the limiting resolution of our eye, and may be a better single number indicator of 'quality'.

A simple experiment is when one takes a print (or even a zoomed out) version of my sinusoidal grating 'star' target. When I walk to a distance of some 5+ metres, I start to lose the acuity needed to resolve the outer diameter at 100mm diameter. However, it is very hard to find the exact cut-off distance because the contrast of all detail has become very low.

That demonstrates that the limiting resolution only has limited impact on rating the overall 'quality' of my optics (eyes + spectacles). BTW, if I could apply additional post-processing to the recorded image, like we can with a digital image, I would be able to utilize/boost that micro-detail contrast! That's why the limiting resolution is still an important figure to know and exploit to boost the impression of image quality.

And with post-processing, we can boost the MTF response of a system, and thus increase the SQF. We do need at least some contrast response as we approach the Nyquist frequency to be able and utilize it.

Cheers,
Bart
 

Doug Kerr

Well-known member
Hi, Bart,

Hi Doug,

In my opinion, the MTF50 metric is nothing more than an indicator of overall quality, not an indicator of resolution. That recognizes that the CSF favors lower spatial frequencies rather than those at the limiting resolution of our eye, and may be a better single number indicator of 'quality'.
An important outlook. Thanks for that.

That demonstrates that the limiting resolution only has limited impact on rating the overall 'quality' of my optics (eyes + spectacles). BTW, if I could apply additional post-processing to the recorded image, like we can with a digital image, I would be able to utilize/boost that micro-detail contrast! That's why the limiting resolution is still an important figure to know and exploit to boost the impression of image quality.
Again, an interesting and important outlook.

And with post-processing, we can boost the MTF response of a system, and thus increase the SQF. We do need at least some contrast response as we approach the Nyquist frequency to be able and utilize it.
Ah, yes.

Thanks so much for all that.

Best regards,

Doug
 

Doug Kerr

Well-known member
The doctrine that I call the "super-simplified Swedish SQF" (SSSS) suggests that, for typical photographic systems, a good indicator of overall image subjective "sharpness" is the value of the system MTF at the spatial frequency which corresponds to an angular spatial frequency at the viewer's eye of 14 cycles/degree.

We note that applying this doctrine depends on our assuming a specific viewing situation; that it, the size of the print or on-screen image compared to the image on the focal plane, and the distance from which it will be viewed.

We can relate angular spatial frequency at the eye to spatial frequency at the focal plane with this equation:

z = 57.3 ZS/Ds

where:

Z is the angular spatial frequency (at the eye) of interest, in cycles/degree
z is the corresponding spatial frequency at the focal plane, in cycles/mm
S is some dimension (e.g., height) of the viewed image, in mm
s is the corresponding dimension of the image at the focal plane, in mm
D is the distance from which the image is viewed, in mm

57.3 is an approximation of 180/pi, and is used to convert an angle in degrees to an angle in radians, which can then be used as an approximation of the tangent of the angle.

Now, how does that work our for our SSSS value of Z=14 cy/deg, for some assumed viewing situation?

We will assume:

• An image on the focal plane of dimensions 36 mm × 24 mm

• A viewed image of dimensions 12 in x 8 in (304.8 mm × 203.2 mm)

• A viewing distance of 16 in (406.4 mm)

Plugging these into the equation above, we find that the corresponding spatial frequency at the focal plane, z, 16.7 cy/mm (a startlingly small value). This corresponds to about 400 cycles per picture height (24 mm).

So does this mean that if the system MTF at 16.7 cycles per mm is 95%, the images it generates should be expected to have a sharpness "score" of 95%? Yes, per the SSSS doctrine.

But suppose the system MTF at 16.7 cy/mm is 95%, but it drops very rapidly above that, perhaps falling to 10% at 75% of the Nyquist frequency of our camera?

Well, we need to remember that the limiting resolution of the eye is at about 30 cy/deg, or only about twice the SSSS magic number. At an angular frequency of 24 cy/deg, the eye's contrast response is only about 20% of its maximum value.

So, in the viewing situation assumed above, the portion of the system MTF above about 24 cy/mm (about 576 cy/PH in the example) does not contribute significantly to the perceived sharpness of the viewed image.

Now, in what viewing situation would the SSSS "magic frequency" in terms of spatial frequency at the sensor be larger (and thus less surprising)? For an image of greater angular dimensions (as seen by the eye): larger in "inch" dimensions (compared to the size of the focal plane image, of course), or viewed from a smaller distance. That is, in the event of "pixel peepage".

Now lets take another case. We shoot (with a 24 × 36 × mm format) a full-length shot of a person and print the image as a "standup" poster 72 in high (essentially full-size). We contemplate this being viewed from a distance of 24 in.

Now the SSSS magic frequency at the focal plane would be 66.8 cy/mm (1603 cycles across the shorter dimension of the format, 24 mm).

Now, keeping the MTF at that frequency in the "90's" (for a good SSSS "score") is challenging. So we well may not be able to get the "quality" result we may want in this situation with a camera with a 24 mm × 36 mm format.

Very interesting.

Best regards,

Doug
 

Asher Kelman

OPF Owner/Editor-in-Chief
The doctrine that I call the "super-simplified Swedish SQF" (SSSS) suggests that, for typical photographic systems, a good indicator of overall image subjective "sharpness" is the value of the system MTF at the spatial frequency which corresponds to an angular spatial frequency at the viewer's eye of 14 cycles/degree.

Doug,

I'm in awe at your efforts to pull understanding out of the challenging concept of "image quality". I cannot contribute more than a large "Thanks!" to you and to others, such as Bart and Jerome who have a stronger engineering and light perception background.

...............Now lets take another case. We shoot (with a 24 × 36 × mm format) a full-length shot of a person and print the image as a "standup" poster 72 in high (essentially full-size). We contemplate this being viewed from a distance of 24 in.

Now the SSSS magic frequency at the focal plane would be 66.8 cy/mm (1603 cycles across the shorter dimension of the format, 24 mm).

Now, keeping the MTF at that frequency in the "90's" (for a good SSSS "score") is challenging. So we well may not be able to get the "quality" result we may want in this situation with a camera with a 24 mm × 36 mm format..........


So, with the same "quality" requirements, for this 72" picture of yours: can you estimate the new size of a sensor or film, (that had similar quality of information worth scanning up to 4,000 dpi), to also get such a high quality print viewable. Except keep the viewing distance unchanged.

Asher
 

Doug Kerr

Well-known member
Hi, Asher,

I'm in awe at your efforts to pull understanding out of the challenging concept of "image quality". I cannot contribute more than a large "Thanks!" to you and to others, such as Bart and Jerome who have a stronger engineering and light perception background.

So, with the same "quality" requirements, for this 72" picture of yours: can you estimate the new size of a sensor or film, (that had similar quality of information worth scanning up to 4,000 dpi), to also get such a high quality print viewable. Except keep the viewing distance unchanged.

This is a tricky quest, since to do it "rigorously" I would need to see the MTF curve for the presumed system (which of course largely revolves around a lens that would be suitable for such a setup).

But let me see if I can conjure a "credible" model.

I'm not sure what "similar quality of information worth scanning up to 4,000 dpi)" means. Whatever it means, that sounds pretty "awesome".

Just now, I can think of no way to insinuate that "aspiration" into a model of viewed image sharpness based on the SSSS doctrine.

More likely, if we were thinking in terms of film capture, followed by scanning and digitization, I would want to think in terms of a scanning process that did not seriously degrade the end-to-end MTF at the SSSS magic spatial frequency.

For example, if in fact our "workable" model of a suitable process has an SSSS magic spatial frequency on the film of, say, 40 cy/mm, then in simplistic terms, that might only call for scanning with a pixel pitch of perhaps 120 px/mm (although I know nothing about the MTF of high-quality film scanners).

Later.

Best regards,

Doug
 

Doug Kerr

Well-known member
Norman Koren suggests:

A typical dedicated film scanner has a characteristic MTF that can be approximated by:

MTFscan( f ) = |sinc( f /dscan)|^3
where sinc(x) = sin(πx)/(πx) if x is nonzero ; sinc(0) = 1
|...| denotes absolute value.​

dscan is the scanning "density" in px/mm.

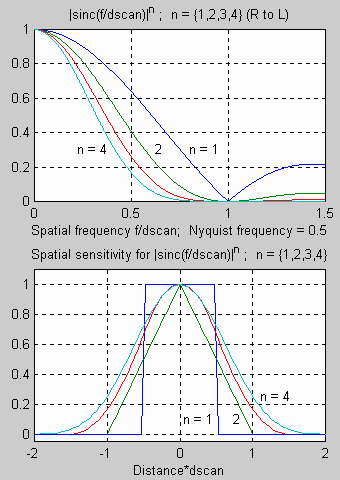
In this figure (from Koren):

sincpower.gif


in the top panel, that MTF is the one shown in red. Here, the scale of spatial frequency is such that 0.5 represents the Nyquist frequency for the scan density involved.

In fact, as Koren explains here:

http://www.normankoren.com/Tutorials/MTF2.html

(just above the green box captioned "The Nyquist sampling theorem and aliasing"), the exponent 3 makes the function fit the realities that bring the Kell factor into the picture (!) plus typical other "degradations" in the scanner. (For an "ideal" scanner, with "100% fill" phtodetectors, the blue curve would apply.)

Note here that MTF50 (often taken as suggesting the "resolution" of the system) falls at about 80% of the Nyquist frequency (a credible "Kell factor" outlook).

If we consider Velvia film, for which we can consider the limiting resolution to be 80 cy/mm, there would seem to me to be little to be gained by scanning an image captured on it it (with a high-quality dedicated film scanner) at a greater density than perhaps 250 px/mm.

But I've never done any of this, so there may well be considerations that I am unaware of.

Just an observation.

Best regards,

Doug
 

Asher Kelman

OPF Owner/Editor-in-Chief
...........
If we consider Velvia film, for which we can consider the limiting resolution to be 80 cy/mm, there would seem to me to be little to be gained by scanning an image captured on it it (with a high-quality dedicated film scanner) at a greater density than perhaps 250 px/mm.

hmm, Doug, that figure for Velvia, an equivalent of ~ 600 dpi seems more like the limiting resolution of some prints. A good Velvia sheet of film should have information worth scanning up to at least 3,000 dpi and the durst rep told me they are now scanning up to 8000 dpi. I guess there must be useful information for that degree of sophistication. Even drum scan at 5,000 dpi are common enough, and if there was no benefit, why would they get orders for such high resolution scans?

Asher
 

Doug Kerr

Well-known member
Hi, Asher,

hmm, Doug, that figure for Velvia, an equivalent of ~ 600 dpi seems more like the limiting resolution of some prints. A good Velvia sheet of film should have information worth scanning up to at least 3,000 dpi and the durst rep told me they are now scanning up to 8000 dpi. I guess there must be useful information for that degree of sophistication. Even drum scan at 5,000 dpi are common enough, and if there was no benefit, why would they get orders for such high resolution scans?

Thank you.

Best regards,

Doug
 

fahim mohammed

Well-known member
I had to read through this treatise..last night between glasses of non-alcoholic beer. Why?
Because somebody had taken the trouble to pen it. And for any knowledge that might stick in my craw.

Most of it is way over my head.

But it only increases my respect for Doug, for the knowledge he possesses and his willingness to spend time imparting it to others. Often sprinkled with with and humor.

A rare combination.

Thank you Doug for keeping me awake last night.
 

Doug Kerr

Well-known member
Hi, Fahim,

I had to read through this treatise..last night between glasses of non-alcoholic beer. Why?
Because somebody had taken the trouble to pen it. And for any knowledge that might stick in my craw.

Most of it is way over my head.

But it only increases my respect for Doug, for the knowledge he possesses and his willingness to spend time imparting it to others. Often sprinkled with with and humor.

A rare combination.

Thank you Doug for keeping me awake last night.
Thanks so much.

It is not always clear how we can use this knowledge to asst our photography, but at the least I think we should let it "inform" us.

Best regards,

Doug
 

Doug Kerr

Well-known member
I recently corresponded with Norman Koren, among other things the father of the Imatest image analysis suite, on a matter related to the Granger-Cupery SQF.

As an aside, Norman pointed out to me that today greater emphasis is placed on a newer, but closely-closely-related, metric for image quality (in the sense of "sharpness"): the CPIQ metric acutance.

CPIQ refers to the Camera Phone Image Quality initiative, originally conducted under the auspices of the International Imaging Industry Association (I3A), but now conducted under the auspices of the IEEE Standards Association.

Although the motivation for the initiative is obvious from its title, many of the image assessment protocols developed under it (including the acutance metric) are equally applicable to photography in general.

The metric acutance (the word, etymologically, essentially means "sharpness") proceeds from a premise almost identical to the more elaborate form of the Granger-Cupery metric SQF. Basically, we take the MTF of the system of interest and multiply it (at each spatial frequency) by the Contrast Sensitivity Function (CSF) of the eye.
In this case, a specific CSF is used, one specified for use in connection with the ISO standard for assessing visual noise in images.​

Of course, since the CSF applies to the eye, the assumed viewing conditions (essentially the magnification of the viewed image compared to the "focal plane" image, plus the viewing distance) are taken into account, and the result is only applicable to that assumed viewing situation. Thus, as with the original SQF, we cannot ask about the acutance of a certain camera with a certain lens without also specifying the viewing conditions of interest.

The area under the resulting curve is determined (by integration) and the properly-scaled result is stated as the acutance value.

As with the SQF, a value of 100% (1.0) is "perfect"; it would result from a system MTF that was 100% across the entire pertinent band of spatial frequency.

A difference between this algorithm and the "elaborate" SQF algorithm is that for SQF the integration is based on a logarithmic scale of spatial frequency (thus essentially applying an overall decreasing weighting by frequency) while in the acutance algorithm the integration is based on a linear scale of spatial frequency.

The next layer of the CPIQ acutance protocol is to derive, from the basic acutance value, an "objective measure" (OM), which is a sort of "demerit score" of un-sharpness. An acutance in the range of 0.8851-1.000% is said to have an OM of 0, and an acutance of zero (the worst possible value) is said to have an OM of 0.8851.

That is, an increase in the acutance beyond 0.8851 does not contribute to an improvement in the perceived quality.

It is interesting that, in the CPIQ documentation, OM is spoken of as "an objective measure of blur" (blue emphasis mine).

The final step is to express the OM as another metric on a scale whose units are the "just noticeable difference" (JND) in perceived quality. A value of 0 JND represents no loss of quality (that is, an acutance of 0.8851 or greater). An acutance of 0 gets a JND score of 34.6.

This metric (the bottom line of this long exercise) does not have a name. It is spoken of as "JND's of quality loss". (Thus perhaps its name is "quality loss" and its unit the JND.)

Most photographic standards suffer from this sort of editorial carelessness. By this time in the process, everybody just wants to go home. "They know what they mean."​
The Imatest suite will evaluate a photographic system in terms of the CPIQ acutance metric as well as both "simplified" and "elaborate" forms of the Granger-Cupery SQF metric. Information on that can be found here:

http://www.imatest.com/docs/i3a-cpiq-support/

Best regards,

Doug
 

Doug Kerr

Well-known member
I have called attention to the fact that, in the determination of the Granger-Cupery SQF metric, the product of the system MTF and the assumed contrast sensitivity function of the eye (CSF), was integrated on the basic of a logarithmic scale of spatial frequency. That is, if we in fact plotted that product function on a logarithmic scale of spatial frequency, we are taking the area under it.

Granger and Cupery, in their seminal paper, explain this use of the logarithmic scale as prompted by intuition in the face of the fact that in so many human perceptual matter, the human response is logarithmic.

And evidently that approach turned out to work well in practice.

As Carla says, "Better lucky than good."

One author (I forget just who or where; likely in some PhD dissertation) explains the logarithmic basis this way:

• The amount of content in a certain spatial frequency range in a typical image (what we would speak of as "energy" in an electrical signal) declines with increasing spatial frequency.

• Thus we should give decreasing weight to the MTF-CSF product as frequency increases.

• If the relative content by frequency is typically inversely proportional to frequency, then the corresponding declining frequency weighting is to weight by 1/f.

• If we use a logarithmic scale of frequency as the basis of our integration, it will do just that.[1]

OK.

Evidently the researchers involved in the path to the CPIQ found that Granger and Cupery were not as lucky as they might have been.

In any case, there is no implied inverse weighting by frequency in the CPIQ acutance integration (that is, the premise of the integration is not a logarithmic scale of frequency).

[1] For the calculus masochists here:

d(log x) = (1/x) dx​
Thus if we integrate a function of x using a logarithmic scale of x (that is, the integral ends with "d(log x)" ), the result is the same as if we scaled the function by 1/x and then integrated that.​

Best regards,

Doug
 

Asher Kelman

OPF Owner/Editor-in-Chief
Doug,

There may be a limit of energy that the brain commits to discriminating between fine details. As it is, the human brain accounts for about 20% of the metabolic energy of our food consumption! So demanding higher level of detail perception, might give an ever decreasing benefit once the gestures and form of what we see is defined beyond doubt and the type of object and identity is established with little leeway for error.

It may be that the term, "frequency", as used in MTF and other "image quality" discussion, is not related to the physical nature of light. That I don't know. However, here are some ideas on the frequency and energy relationships of light whether from a radio tower, a TV station, the sun, a flashlight, an Xray in the hospital, a nuclear weapon or a radiation therapy treatment linear accelerator.

• "The amount of content in a certain spatial frequency range in a typical image (what we would speak of as "energy" in an electrical signal) declines with increasing spatial frequency."

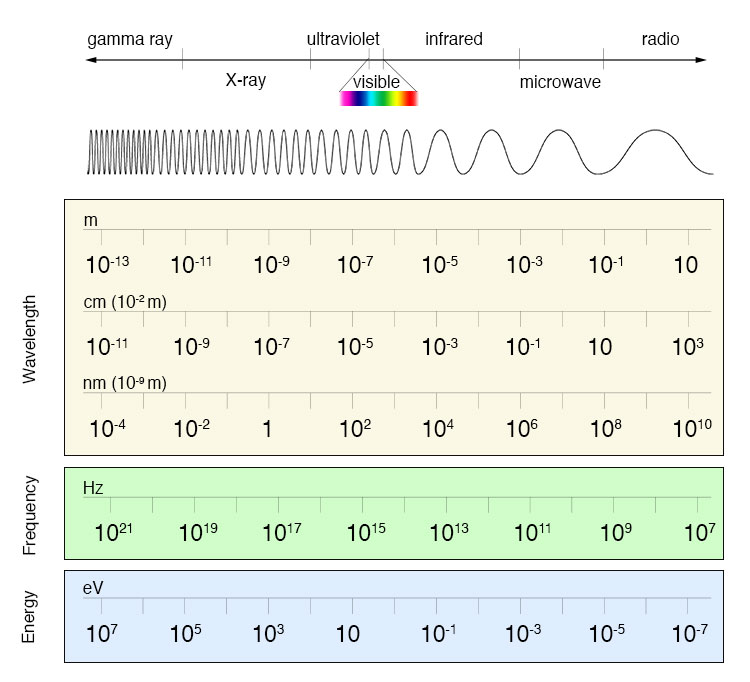
It may be intuitive that there's less "energy" with higher frequency, but with light, the opposite is true, with higher frequency, of the electromagnetic waves carry more energy. Actually, with lower energy, such at broadcast frequencies, the photons behave more like waves. At higher frequencies, the photons pack far more energy and behave more like photons.

EM_spectrum_compare_level2_lg.jpg


NASA Image​

.............but appreciating detail in images we get from the light coming into our eyes, is a matter for the brain discriminating between different accumulations of energy over a spatial map and then assigning significance to variations. Essentially, the brain has to determine edges and perhaps do first and second derivatives of the rates of change. So where there is very close distance and little difference in contrast, the brain does not devote further computing power as there's likely no survival benefit for investing even more computing energy on such progressively more difficult judgements. So I guess that's the explanation of "assumed contrast sensitivity function of the eye (CSF).

I just would like to know if the two uses of the term, "frequency", are coherent?

Asher
 

Doug Kerr

Well-known member
Hi, Asher,

I just would like to know if the two uses of the term, "frequency", are coherent?

Well, if for example, we speak of an electrical signal burst (a waveform of a certain finite duration) having a certain frequency (you know I always have to start with the electrical analogy), there is no "quantum" of it (such as a photon) such that for different frequencies that quantum conveys different amounts of energy.

All we can do is describe the amount of energy in the burst and having done so, then of course the amount of energy is independent of frequency.

When we speak of luminance patterns of a certain spatial frequency, it is hard in any case to think in terms of energy (which is why my metaphor was rather forced, and probably ill-advised).

But let's consider the amplitude of modulation represented by a luminance pattern of a certain spatial frequency. It is certainly parallel to the amplitude of an electrical signal. But we can't equate the square of that amplitude to power, as we can with an electrical signal.

For a certain amplitude, the impact on the human visual system varies with spatial frequency (which is what the CSF portrays). But that does not steadily increase with spatial frequency (as the energy in a photon increases with frequency).

So I don't think there is any correspondence between the two concepts.

Best regards,

Doug
 

Doug Kerr

Well-known member
It is interesting to note that various "overview" documents from around 2012 that discuss the CPIQ work refer to one of the image attributes to be defined as "edge acutance".

One planning paper lists the CPIQ "technical specifications" as to comprise: Color Uniformity, Edge Acutance (SFR), Lateral Chromatic Aberration, Lens Geometric Distortion, Texture Acutance, Visual Noise, Exposure Time, White Balance, Color Saturation, Veiling Glare.​

Today we see one of the attributes that is defined in the CPIQ doctrine is called "acutance", and often that name is accompanied by "Spatial Frequency Response (SFR)". This may or may not be the same concept earlier spoken of as "edge acutance (SFR)".

SFR can be though of as essentially a synonym for "MTF".​

Various definitions of "edge acutance" emphasize it as a measure of the ability of an imaging system to present a "sharp edge" between areas of different color (luminance, in a monochrome setting).

The DxOMark glossary of terms includes the following:

Acutance (Edge Acutance/Texture Acutance)

An objective measure of sharpness which takes into account the sensitivity of the human visual system to specific spatial frequencies and the viewing distance of an image. Edge acutance refers to the ability of a photographic system to show a sharp edge between contiguous areas of low and high illuminance. Texture acutance refers to the ability of a photographic system to show details without noticeable degradations.​

I will try and find out whether this represents a change by the CPIQ working group in the actual nature of one of the key attributes to be defined or just a change in outlook as how to describe it.

The concept of "edge sharpness" seems closely related to a system metric we often hear about, the "rise 'time' " of the system response to a sharp edge in the target. In fact, it turns out that, for "classical" MTFs, the "9-91% rise 'time' "of the edge response is essentially inversely proportional to spatial frequency at which the MTF (SFR) is 0.50 ("MTF50").

The colloquialism "rise time" is borrowed from the corresponding issue in the electrical waveform context. In our case, a more apt name would be "rise distance", but that is not so popular.

Often the 10-90% rise "time" is cited in that same way, but the mathematical demonstration works for the 9-91% rise.​

Yet we know that MTF50 is not a good single predictor of "image quality" (in the sense of "sharpness", wherever that is).

Very interesting.

Best regards,

Doug
 

Doug Kerr

Well-known member
I said above (emphasis added here):

One planning paper lists the CPIQ "technical specifications" as to comprise: Color Uniformity, Edge Acutance (SFR), Lateral Chromatic Aberration, Lens Geometric Distortion, Texture Acutance, Visual Noise, Exposure Time, White Balance, Color Saturation, Veiling Glare.

Analysis of some of the literature in this field suggests that the acutance defined by the current CPIQ doctrine might in fact be the Texture Acutance referred to in that list.

Best regards,

Doug
 

Asher Kelman

OPF Owner/Editor-in-Chief
The concept of "edge sharpness" seems closely related to a system metric we often hear about, the "rise 'time' " of the system response to a sharp edge in the target. In fact, it turns out that, for "classical" MTFs, the "9-91% rise 'time' "of the edge response is essentially inversely proportional to spatial frequency at which the MTF (SFR) is 0.50 ("MTF50").
The colloquialism "rise time" is borrowed from the corresponding issue in the electrical waveform context. In our case, a more apt name would be "rise distance", but that is not so popular.

Often the 10-90% rise "time" is cited in that same way, but the mathematical demonstration works for the 9-91% rise.​
Yet we know that MTF50 is not a good single predictor of "image quality" (in the sense of "sharpness", wherever that is).

Doug,

In mathematically recognizing edges in a picture, is what's done essentially determining "rise time" as one climbs stairs of different signal height and would a tool like Imatest™ be looking at something like first and second derivatives along steps that sometimes might be strewn with rubble to conceal them?

Asher
 

Doug Kerr

Well-known member
Hi, Asher,

In mathematically recognizing edges in a picture, is what's done essentially determining "rise time" as one climbs stairs of different signal height and would a tool like Imatest™ be looking at something like first and second derivatives along steps that sometimes might be strewn with rubble to conceal them?

Well, ideally, in testing a system with regard to its edge spread function we would use a test chart with well-defined edges and we hope that there would be a minimum of "rubble" (it only being system noise).

But yes, steps do have to be taken in such software to be able to ascertain the edge spread function (or some simple measure of it, such as its rise time) in the presence of such "rubble".

We are helped at that by the fact that since we are using an actual edge (of finite "length"), we get multiple looks at the system response to the edge (along multiple rows of sensels) and so the "rubble" can be "seen through" by correlation over the multiple "looks".

Another clever ploy is in fact the use of a slightly slanted edge. In this way, the "register" of the edge with the discrete pattern of sensels advances slightly from row to row, thus in effect giving us a higher resolution of observation of the edge response than from a single row of sensels (or even multiple rows with the same alignment with the edge).

This is by the way discussed at some length here:

http://dougkerr.net/Pumpkin/articles/MTF_Slant_Edge.pdf

The presentation is not highly analytical, and there are some nice illustrations.

Best regards,

Doug
 
Top