Doug Kerr
Well-known member
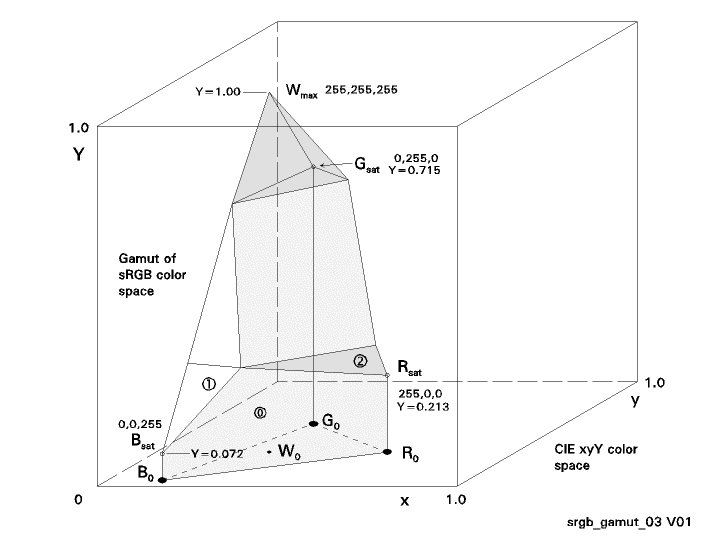
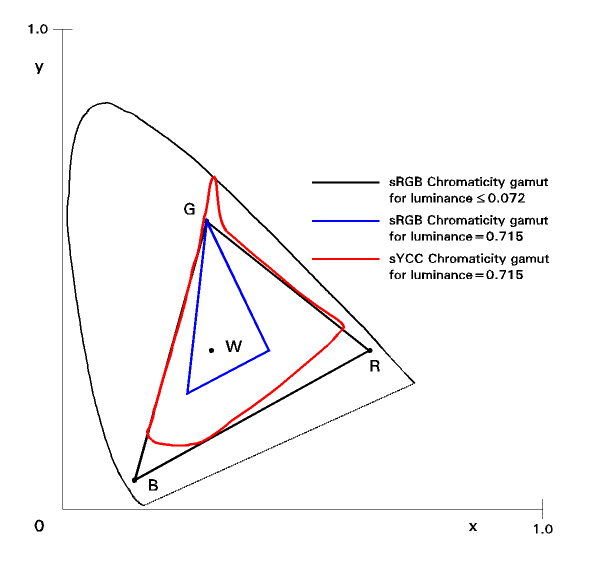
Often, we see a CIE x-y chromaticity diagram with the chromaticities of the three sRGB primaries ("R", "G", and "B") plotted.
Often these are joined with straight lines to form a triangle, which we hear "bounds the gamut of the sRGB color space". But that is not really so.
That gamut must be represented in three-dimensional space; this triangle shows only the chromaticity gamut for a range of small (but non-zero) luminances. At the other extreme, for a relative luminance of 1.0, the chromaticity gamut is only a point (at the white point of the color space on the chromaticity plane).
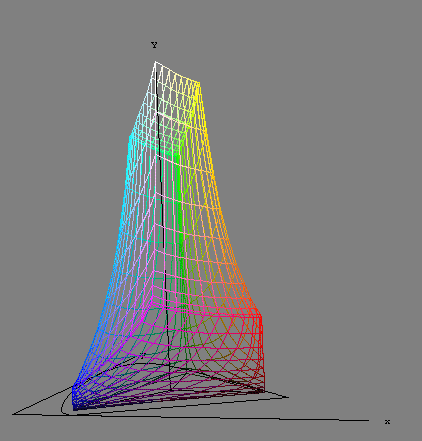
This figure is an oblique view of the three-dimensional solid that shows the color gamut of the sRGB color space as "plotted" in the CIE x-y-Y color space.
Two faces are arbitrarily shaded to help us grasp the peculiar shape. They have no special significance.
The x and y coordinates of this are the same as the coordinates of the familiar x-y chromaticity diagram, while the Y axis represents relative luminance.
The primaries are labeled Ro, Go, and Bo here since we will have plenty of other R's, G's, and B's.
We might expect the figure to be roughly symmetrical, but it isn't, mostly because of the different impact of the three primaries on luminance (reflecting the eye's varying sensitivity as a function of wavelength).
The point labeled Bsat is the color 0,0,255. This is the highest luminance fully-saturated "blue" we can represent in sRGB. Its luminance isn't very high (0.072); the B primary doesn't have much "leverage" on luminance.
If we wanted a color of any higher luminance, since B is already "wide open" (255), we would have to add R and/or G. And that would "dilute" the saturation of our "blue".
Up to the luminance of Bsat, the cross-section of the figure is the same as the low-luminance chromaticity gamut. But above that luminance (for the reason we discussed just above), the "B" edge starts to fall back toward the "center pole" (the vertical line through the chromaticity of the sRGB white point, Wo). Above this luminance, we can no longer have a "maximum saturation blue".
The point marked Rsat (255,0,0) is the highest-luminance fully saturated "red" we can have. The story is like the story for Bsat. At this point, the "R" edge of the solid stats to fall back to the center pole. Above this luminance (0.213), we can no longer have a "maximum saturation red".
Finally, the point marked Gsat (0,255,0) is the highest-luminance fully saturated "green" we can have. The story is like the story for Bsat and Rsat. At this point, the "G" edge of the solid stats to fall back to the center pole. Above this luminance (0.715), we can no longer have a "maximum saturation green".
From this point up, the solid is a triangular pyramid. When we reach luminance 1.00, all three edges have "fallen to the center pole", converging at the point 255,255,255, "wide-open white", the largest luminance we can have, at which point the only available chromaticity is reference white.
Note that there is no axis on this representation that indicates true colorimetric saturation (nor any of the pseudo-saturation values found in such color spaces as HSL, HSV, and HSB, nor even the RGB-oriented "saturation relative to the maximum for this hue" ).
Best regards,
Doug
Often these are joined with straight lines to form a triangle, which we hear "bounds the gamut of the sRGB color space". But that is not really so.
That gamut must be represented in three-dimensional space; this triangle shows only the chromaticity gamut for a range of small (but non-zero) luminances. At the other extreme, for a relative luminance of 1.0, the chromaticity gamut is only a point (at the white point of the color space on the chromaticity plane).
This figure is an oblique view of the three-dimensional solid that shows the color gamut of the sRGB color space as "plotted" in the CIE x-y-Y color space.
Two faces are arbitrarily shaded to help us grasp the peculiar shape. They have no special significance.
The x and y coordinates of this are the same as the coordinates of the familiar x-y chromaticity diagram, while the Y axis represents relative luminance.
The primaries are labeled Ro, Go, and Bo here since we will have plenty of other R's, G's, and B's.
We might expect the figure to be roughly symmetrical, but it isn't, mostly because of the different impact of the three primaries on luminance (reflecting the eye's varying sensitivity as a function of wavelength).
The point labeled Bsat is the color 0,0,255. This is the highest luminance fully-saturated "blue" we can represent in sRGB. Its luminance isn't very high (0.072); the B primary doesn't have much "leverage" on luminance.
If we wanted a color of any higher luminance, since B is already "wide open" (255), we would have to add R and/or G. And that would "dilute" the saturation of our "blue".
Up to the luminance of Bsat, the cross-section of the figure is the same as the low-luminance chromaticity gamut. But above that luminance (for the reason we discussed just above), the "B" edge starts to fall back toward the "center pole" (the vertical line through the chromaticity of the sRGB white point, Wo). Above this luminance, we can no longer have a "maximum saturation blue".
The point marked Rsat (255,0,0) is the highest-luminance fully saturated "red" we can have. The story is like the story for Bsat. At this point, the "R" edge of the solid stats to fall back to the center pole. Above this luminance (0.213), we can no longer have a "maximum saturation red".
Finally, the point marked Gsat (0,255,0) is the highest-luminance fully saturated "green" we can have. The story is like the story for Bsat and Rsat. At this point, the "G" edge of the solid stats to fall back to the center pole. Above this luminance (0.715), we can no longer have a "maximum saturation green".
From this point up, the solid is a triangular pyramid. When we reach luminance 1.00, all three edges have "fallen to the center pole", converging at the point 255,255,255, "wide-open white", the largest luminance we can have, at which point the only available chromaticity is reference white.
Note that there is no axis on this representation that indicates true colorimetric saturation (nor any of the pseudo-saturation values found in such color spaces as HSL, HSV, and HSB, nor even the RGB-oriented "saturation relative to the maximum for this hue" ).
Best regards,
Doug