• Please use real names.

    Greetings to all who have registered to OPF and those guests taking a look around. Please use real names. Registrations with fictitious names will not be processed. REAL NAMES ONLY will be processed

    Firstname Lastname

    Register

    We are a courteous and supportive community. No need to hide behind an alia. If you have a genuine need for privacy/secrecy then let me know!
  • Welcome to the new site. Here's a thread about the update where you can post your feedback, ask questions or spot those nasty bugs!

The modulation transfer function (MTF) - a tutorial

Doug Kerr

Well-known member
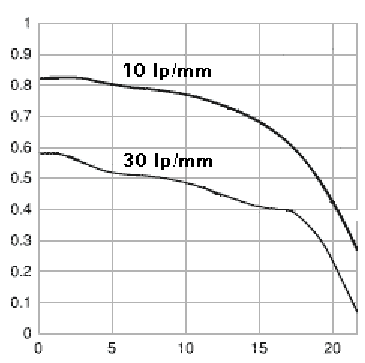
We often see presented for a lens a set of curves described as the "modulation transfer function (MTF) curves for the lens. Here is an example, for the Canon EF 18mm f/1.8 USM lens:

ef_85_18mtf.gif


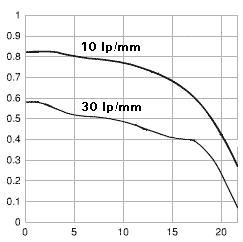
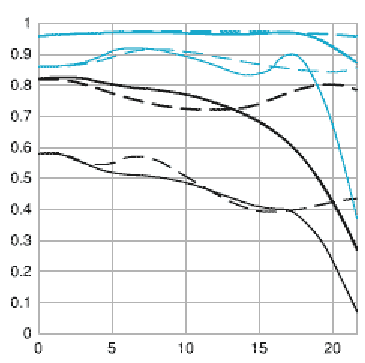
MTF curves for Canon EF 85mm f/1.8 USM lens
Courtesy of Canon , U.S.A.​

These tell us several important things about the lens' optical performance - and in the form we normally see them, fail to tell us some other equally-important things.

I thought I would explain a little about the MTF curves. The tutorial will be in sections of hopefully-digestible size.

**********

THE MODULATION TRANSFER FUNCTION (MTF)

Part 1


Modulation

Here and in the rest of this article I will, to keep things a little simpler, assume the use of monochrome (black-and-white) photography.

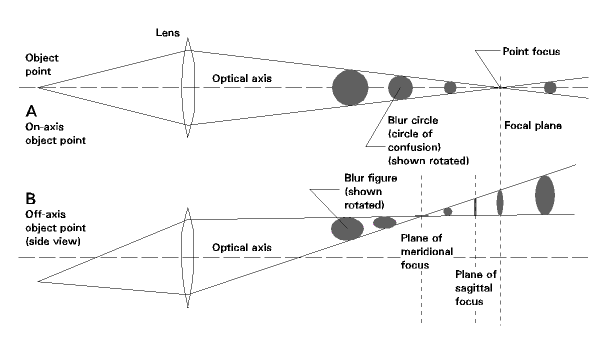
In a scene, detail is conveyed by changes in luminance. If there were no change in luminance over a region, there would be no detail there.

In our context, the variation in luminance that constitutes detail is called modulation.

Imagine that we have detail that is a recurring pattern (perhaps stripes on a garment). If we survey that along a path across the stripes, we can quantity the degree of modulation (luminance change) by the property depth of modulation, which we can define this way:

ML = (Lmax-Lmin)/(Lmax+Lmin)

where ML represents the depth of modulation of the luminance, Lmax is the maximum luminance in the region, and Lmin is the minimum luminance in the region.

In the image on the sensor, the detail is conveyed by changes in the illuminance deposited by the lens

There, we can also define the depth of modulation in a similar way:

ME = (Emax-Emin)/(Emax+Emin)

where ME is the depth of modulation of the illuminance deposited on the image and Emax and Emin are the maximum and minimum values of the illuminance.

Conserving the modulation

Ideally, the pattern of illuminance deposited on the sensor by the lens would have, for any given small region, the same depth of modulation as we had in the scene luminance. But we never enjoy that ideal, for these reasons (among others):

• Flare and scattering in the lens allow some light bright parts of the image to flood other areas, diluting the depth of modulation.

• If the detail is fine (rapid changes in the luminance, and thus a high spatial frequency), the decline in resolution dilutes the depth of modulation. (For example, the "extinction resolution" of a lens is the spatial frequency at which the depth of modulation of the illuminance on the sensor has dropped to essentially zero.)

We can quantify the degree to which the lens "conserves" the original depth of modulation by using the ratio of the depth of modulation of the illuminance on the sensor to the depth of modulation of the luminance on the scene. We will call that for the moment the "modulation transfer ratio".

Its ideal (and highest possible value) is 1.0.

Modulation transfer ratio - a function of other factors

Even for a given lens, set to a given focal length (if a zoom), and a certain f-number, the modulation transfer ratio varies with (most notably):

• The spatial frequency of the modulation (the "fineness of the detail")

• The location on the frame (distance from the center).

Thus, we say that the modulation transfer ratio is a function of those two factors.

The specific way it varies could be described as the "modulation transfer ratio function".

The modulation transfer function (MTF)

When dealing with a function, mathematicians typically use the same name to describe both the relationship and the actual value of the result. (So you can see we are already set up for the possibility of confusion!)

In this case, the name used for both those things is "modulation transfer function." Thus that term means both "the modulation transfer ratio" (a very clear name that, sadly, we will not hear again) and "the way the modulation transfer ratio varies with other factors". We will mostly use it in the first sense.

[To be continued in Part 2]
 

Doug Kerr

Well-known member
THE MODULATION TRANSFER FUNCTION (MTF) - Part 2

THE MODULATION TRANSFER FUNCTION (MTF)

Part 2


How to plot it

Again here we will assume that we are limiting our work to a specific lens, set to a specific focal length (if a zoom), and at a specific f-number. We will also set aside for the moment the mysterious matter of the sagittal and meridional responses of the lens.

We noted before that the modulation transfer function (that is, the numerical value of what we earlier called the modulation transfer ratio) is a function of spatial frequency and distance from the center of the frame. (These are the "independent variables" of the relationship.) To actually plot this, we would need a three-dimensional plot (not to handy to print in books).

But there is a practical way to get around that.

I'll move away from our specific function for a minute to illustrate the principle.

Suppose we have Y as a function of X and Z (I'll use an arbitrary function). We can choose some value of Z, hold it constant, and plot Y versus X. We label that curve with that value of Z.

Now we choose another value of Z, hold it constant, and plot Y versus X. We label that curve with that new value of Z. And so forth. This is called the "family of curves" approach to dealing with a function of two (or more) independent variables.

We see an example here for two values of Z:

function_11.gif

But we can do it in another way, if that better suits what we wish to illuminate by our figure.

We can choose some value of X, hold it constant, and plot Y versus Z. We label that curve with that value of X.

Now we choose another value of X, hold it constant, and plot Y versus Z. We label that curve with that new value of X. And so forth.

We see an example of that here for two values of X:

function_12.gif

In the modulation transfer function (MTF) plots we usually see, two different values of spatial frequency are chosen, and for each we plot the MTF versus distance from the center of the frame.

That means there would be two curves in the "family". In the MTF curves we usually see, there are eight. That's because of things we said would be, for the moment, kept constant (such as the f-number) or ignored (such as the sagittal vs. meridional matter). Lets continue to keep it simple.

What else might we have done? Well, we might first choose some distance from the center of the frame (like zero) and plot the MTF versus spatial frequency. Then we would pick some other distance from the center and for that, again plot MTF versus spatial frequency, and so forth.

In fact, this is the form of the plot of the MTF function (I know that sounds redundant) that is needed for most scientific work dealing with lens resolution and the like. It's like the frequency response curve of an audio amplifier.

In fact, let's use a parable involving audio work to reveal one of the weaknesses of the way we usually see lens MTF curves.

Suppose we are testing a new sound system in an auditorium. We feed the system a test tone at a frequency of 1000 Hz, and use a sound level meter to determine the sound level at points along a line running from the orchestra pit to a rear corner of the auditorium. We plot those readings (in terms of sound level vs. distance) on a chart, and label the curve "1000 Hz".

Then we do the same with a test tone at 3000 Hz. We plot the results and label the curve "3000 Hz".

We can see nicely how, at those two frequencies, the sound level falls of as we go to the corner.

But suppose were are interested in the frequency response of the system at some particular location, or at several. At one of those locations, what is the relative sound level at 5000 Hz? 10000 Hz? 20000 Hz?

Well, we have no clue. Those were never measured.

Now could we have measured at some other frequencies (for example, 5000, 10000, and 20000 Hz), and plotted the results on three more curves? Indeed. But we didn't.

Now back to our optical case. In the MTF curves we usually see, the MTF is only determined for spatial frequencies of 10 lines/mm and 30 lines/mm. (Of course we have those at numerous places from the center of the frame to the corner.)

Before we get into trouble, note that "lines" here means in the sense of line pairs (cycles, in engineering terms) per millimeter. How do we know that? Does it say that on the curves? In the introduction to the part of the book where the curves are? Not usually. We are just supposed to know.​

Here we see an MTF plot of that type (it is for the Canon EF 50 mm f/1.8 II lens):

ef_50_18mtf-02.gif

A major reason we consult the MTF curves is to try and see what resolution a lens might deliver. A common criterion of resolution is the spatial frequency where the MTF drops to some fraction of its value at a very low spatial frequency - maybe 10%. Well. let's see what info of that sort we can glean from the MTF curves. Lets think about it at the center of the frame (the left edge of the chart) for starters. Let's see - we have the MTF there at a spatial frequency of 10 line pairs/mm, and at 30 line pairs/mm.

At the center of the frame, what is the MTF at a very low spatial frequency (our reference point)? Dunno. At what spatial frequency does it drop to 10% of that? Dunno.

You can see why optical engineers don't spend much time looking at this kind of MTF plot. ("Noife", says Crocodile Dundee in 'Strine to the thug. "That's no noife.")

[to be continued]
 

Doug Kerr

Well-known member
THE MODULATION TRANSFER FUNCTION (MTF)

Part 3


The whole chart

Now, let's look at the whole MTF chart, the way we generally see it, and look at what the different curves are:

ef_50_18mtf-exp.gif

Here is the legend:

Cyan curves: aperture f/8
Black curves: aperture wide open (f/1.8 in this case)

Heavy curves: Spatial frequency 10 line pairs per millimeter (lp/mm)
Light curves: Spatial frequency 30 line pairs per millimeter (lp/mm)

Solid curves: Sagittal response
Dashed curves: Meridional response

The first aspect of this shows us that, as we have come to expect, the performance of the lens is typically better (higher values of the MTF) for the modest aperture (f/8).

The second aspect of this (variation with spatial frequency) we have already seen, and will revisit in more detail in the next section.

I will discuss the third aspect the matter of sagittal and meridional response) in the next part of this series.

Interpretations

Now lets look again at just the curves for f/1.8 and (arbitrarily) the sagittal response:

ef_50_18mtf-02exp.gif

It is often said that:

• The heavy (lower spatial frequency) curve(s) indicate the contrast of the lens

• The light (higher spatial frequency) curve(s) indicate the resolution of the lens

What might that mean, and why is that?

Well, firstly, of course, a lens does not "have" (nor "generate") contrast. What we look to it to do is to preserve for us, in the image, the contrast in the scene. It does that as well as is possible - at whatever spatial frequency is of interest - when the MTF is 1.0.

So a high value of MTF in the low-frequency curve means that the lens (at whatever part of the frame) well preserves the contrast of "coarse" scene detail (which has low spatial frequency). Now it is that sort of contrast that seems to the casual viewer as being "the contrast" of the scene. Thus the statement above.

But the contrast for finer detail is also important. In fact, as we "run out of resolution", what that means is also a declining ability of the lens to preserve contrast for increasingly finer detail! (The MTF value always - on whatever curve - indicates the lens' ability to preserve contrast. That how MTF is defined!)

So we must keep in mind the "hidden qualifications" in that simplistic statement of the significance of the lower frequency curves.

With regard to the second statement, on the higher frequency curve, higher values of the MTF indicate better preservation of detail components at one specific spatial frequency: 30 lp/mm. Is that an indicator of the "resolution" of the lens? Not actually; that is revealed by the spatial frequency at which the MTF drops to some arbitrarily-chosen fraction of its value at low spatial frequency. The MTF at a particular spatial frequency (30 lp/mm) may hint at that, but it doesn't tell us that.

It's a little bit like trying to find out at what age does the lifting strength of a typical human male drop to 25% of its value at age 18. We have statistics that show, at age 60, his strength is typically down to 65% of its value at age 18. That's all we know. So at what age would his strength be down to 25% of its value at age 18? We have no clue.

How high is a spatial frequency of 30 lp/mm, anyway? Well, in a Canon EOS 1Ds Mark II, the "geometric" resolution, based on pixel pitch, which is the highest resolution we could possibly have (and that only if the lines of the test pattern lined up with the pixel rows) is 78 lp/mm. The typical reported resolution of that camera (on an "extinction" basis) is about 69 lp/mm.

So if we are interested in whether a lens can hold up its end of the deal in that arena, knowing its MTF at 30 lp/mm is only a hint. We would want to know what it is at, perhaps, 65 lp/mm.

So how does one ascertain the "resolution" of a lens from the MTF curve(s)? Well, the higher the 30 lp/mm curve is, the higher is (probably) the resolution of the lens. That's the best we can do.

Would we be better served if the lens manufacturers published MTF curves showing MTF versus spatial frequency (the "scientific" format), up to a spatial frequency in which we might be interested? I think so.

[To be continued]
 

Doug Kerr

Well-known member
THE MODULATION TRANSFER FUNCTION (MTF)

Part 4


Sagittal and meriodinal response

The matter of separate curves for the sagittal and meriodinal response of the lens arises from the lens aberration of astigmatism. This is a complex topic, and the phenomenon has several implications.

The implication that is most directly related to the appearance of two curves is this. For object points off the lens axis, the ability of the lens to "resolve" parallel lines spaced at some (small) distance differs between two directions of orientation of the lines. The two directions are not vertical and horizontal, with regard to the frame, but rather are:

• Parallel to a line from the center of the frame to the point at which we are interested in the lens response.

• Perpendicular to that line.

We see that here:

astig_25.gif

The designation radial of course comes from the fact that this is the direction of the radius, to that point on a circle, centered at the center of the frame, through that point. The designation circumferential comes from the fact that this direction is tangential to the circumference of that circle at the point of interest.

But for various "historical" reasons, these two pattern directions are also designated by two alternative names, sagittal and meridional:

astig_26.gif

Sagittal means (in this context) "as the arrow flies". (It come from the same Latin root as the name of Sagittarius, the archer, the constellation.) The arrow evidently flies from the center of the frame to our test point.

The rationale for the term meridional here is a bit obscure. It is distantly related to the notion of a meridian on the Earth's surface (don't ask how).

In any case, at any point on the frame, the MTF values pertaining to a "test pattern" of lines at a certain spatial frequency, with the two orientations we see above, are the sagittal and meriodinal value of the MTF at that point.

But our interest in the aberration of astigmatism is really not with this discrepancy of MTF. It really lies with how the rays from an off-axis object point (the phenomenon does not occur for on-axis points) are brought to a focus.

Ideally, we think of the rays from an object point being brought to a point, and we hope to focus the camera so that this point lies on the focal plane.

But for real lenses, this doesn't happen. Some of the rays come together at one place, and some at another (along the path of the "cone" of rays). Thus there is no place we can put our focal plane to enjoy a truly point image. This is the "spreading of the point image" that is the mechanism of limited resolution. But the process is radially-symmetrical: the cross-section of the "cone" at its narrowest point is circular.

The same is true of the cone at not its narrowest point, which is what falls on the focal plane for object points for which focus is not perfect. This is why we have a "circle of confusion" on the image from object points not in perfect focus.

But, for off-axis object points, for which the phenomenon of astigmatism comes into play, to a lesser or greater degree, the process is not radially symmetrical. We see that in this figure:

astig_82.gif

In panel A, I have isolated those rays in the cone of light from our object point that happen to pass through the lens across its horizontal diameter. We assume that they come perfectly together (they won't of course, because of things we mentioned previously), and at a certain point along the centerline of the cone, in what we ill call the plane of sagittal focus.

In panel B, I have isolated those rays in the cone of light from our object point that happen to pass through the lens across its vertical diameter. Again, we assume that they come perfectly together, but they do so at a different point along the centerline of the cone, in what is called the plane of meridional focus.

Although this is a little tough to successfully illustrate [I'm working on a drawing, but it's tough!], if we now admit all the rays, and consider them as falling on our film at the plane of meridional focus, the image there will be not a point but rather a blur figure in the form of a horizontal line. Why? Well, the blue rays will come together at a point. But the red rays will pass the plane at various places directly to the left and right of that point (they have not yet come together at that plane). And the other rays (not seen here) will cooperate in that result. The overall result will be essentially a line blur figure in the form of a horizontal line.

If we consider the same story with the camera focused so that the plane of sagittal focus falls on the film, we will get not a point image, nor a blur circle, but rather a blur figure in the form of a vertical line. Here, the blue rays have already come together, and by this time they get to this plane they have already spread, vertically.

We can see the implications of this on the following figure:

astig_92.gif

In panel A, we have an of-axis object point, so the phenomenon of astigmatism doesn't come into play. We assume that the lens has no other aberrations that would prevent the rays from an object point from coming together at a point image.

We assume that the camera is focused so that the point image of our object point indeed falls on the focal plane. But we also consider what image might be produced if the focal plane were placed at other locations (as in the case of misfocus). I have rotated the blur figures at those locations by 90° so we can see them from our vantage point alongside the battle zone. These blur figures are all circular.

In panel B, we have an off-axis object point and we have the effect of astigmatism. Again, we show the blur figures rotated so we can appreciate their shapes.

Note that at the plane of meridional focus, the blur figure is a horizontal line (as I described earlier). At the plane of meridional focus, the blur figure is a vertical line. And in fact, neither of these happen at the focal plane.

So, in the light of all this, what is the impact of astigmatism on our photographic work? Well, mainly:

• We cannot, for off axis object points, ever attain nearly "point focus", needed for an image that is a sharp as the other lens aberrations would allow.

• For objects out of focus (perhaps foreground or background objects), the blur figure will not be circular, typically leading to bokeh that is not "handsome".

Now, does examination of the difference in MTF between the sagittal and meridional "test patterns", at various points in the frame, directly tell us anything about either of those afflictions?

No. The difference between the two curves just shows that there is astigmatism (from another one of its symptoms altogether), and from that diagnosis, we can infer that we will be visited by those two afflictions.

The homily

What is the common simplistic description of all this? "The closer the sagittal and meridional response curve are to one another, the more natural will be a blurred image".

In other words, "less astigmatism, better bokeh".

In summary

I think by now that you can understand why I am a little cynical about MTF curves as we usually see them.

Benediction and dismissal

Well, folks, I think that's all of this any of us can stand. Thanks for dropping by.

Best regards,

Doug
 

Doug Kerr

Well-known member
In another thread on a related topic, Ken Tanaka called attention to the very interesting material on this subject (and many others) in Canon's reference book, EF Lens Work III (the chapter entitled "Optical Terminology").

It is interesting to note that when (on page 205) the illustrate, with three pictures of a cat, differences in combinations of "good" and "bad" resolving power and contrast, they link them to different MTF curves seen not on the "lens catalog" form (MTF vs. distance from the axis) but rather in the "scientific" form (MTF vs. spatial frequency).

This may not be apparent, since the set of cat pictures is not "labeled" nor mentioned in the text, and comes (with the associated set of "scientific" MTF curves) in the middle of the passage discussing making inferences about contrast and resolving power from "lens catalog" form MTF curves.

The three MTF curves related to the cat photos are all for lenses whose resolution we might say was greater than 50 lp/mm based on a criterion of where the MTF dropped to some fairly low fraction of its low-frequency value (the curves do not go far enough to actually do that for a fraction of, say, 30%).

But if we used the more stringent criterion of considering the resolution to be the spatial frequency where the MTF dropped to 50% of its low-frequency value, then the "A" and "C" lenses would both have resolutions probably twice that of the "B" ("bad resolution") lens.

Indeed, the MTF of lens "B" is substantially lower at a spatial frequency of 30 lp/mm than lenses "A" and "C", and thus one could in fact distinguish that lens from the others on "lens catalog" form MTF plots.

This is consistent with my view that the MTF at 30 lp/mm does not really tell us the resolution of the lens, but it can be a clue as to in which lenses is it "better" and in which lenses is it "worse".

In the example "cat" photos, which are reproduces fairly small, the difference between lenses with "good" and "bad" resolving power (that is, higher and lower MTF at 30 lp/mm) is not very apparent.

Again, using a metaphor of audio equipment, if we want to know up to what frequency does an amplifier keep its gain within, say, 6 dB of its gain at 1000 Hz, then its relative gain at 3000 Hz might be a clue, but it certainly is not an indicator. That value might be identical in two amplifiers where the "6 dB rolloff" frequency was 10,000 HZ and 20,000 Hz, quite different with regard to the property in which we were interested. (Avery Fisher certainly did not make his fortune selling amplifiers having a nice high relative gain at 3000 Hz.)

Best regards,

Doug
 

Doug Kerr

Well-known member
I thought I would discuss an issue that sometimes makes it difficult to follow discussions in the area of the modulation transfer function (MTF) of a lens.

I'll start with a metaphor in another area altogether.

Suppose we are interested in the matter of the air temperature in a food storage warehouse. We recognize that it varies with both height above the floor and time of day - that it, it is a function of those two variables.

In "analytical" work, we may give that relationship a name, say "Warehouse Temperature Function" (WTF).

If we want to speak generally of the temperature, we call it "temperature". If we want to mention what the temperature is at a certain height off the floor at a certain time of day, we might say that "At 10:00 am, at 12 feet off the floor, the temperature was 38°F".

If I publish a plot of the temperature vs. height above the floor (with perhaps different curves for different heights above the floor), I will probably label the vertical axis "temperature", and the horizontal axis "height above the floor". And I might say that this set of curves shows the Warehouse Temperature Function (WTF).

But in a learned paper about this matter, a hyper-nerdlisch author may in fact use "WTF" to mean any of these three things:

• The temperature, generically (a variable).

• The temperature at a particular time of day and a particular height above the floor (a value of that variable).

• The relationship between time of day, distance above the floor, and temperature (the description, or definition, of the function).

Thus the author might say, "the life of the food stored at a particular location depends on the average WTF there" (the variable).

Or, "A measurement on shelf B15 at 10:15 am Friday showed the WTF to be 38°F" (a value of the variable).

Or, "The WTF is different with the circulating fans on" (the nature of the relationship of the variables.)

Now that may seem a bit silly, and we wonder whether even dedicated boffins would really write that way. We hope not.

But now let's return to our beloved MTF. Here, the actual property of interest (the analog of "temperature" in our metaphor) is a variable I call the "modulation transfer ratio" (a term you have probably never seen except in my writings). It is defined as the ratio of the depth of modulation conveyed to the image to the depth of modulation of the actual object feature - how much the variation in luminance that constitutes detail is preserved onto the focal plane.

Now the value of the modulation transfer ratio (I'll call it that for a little while) depends on the values of several other variables - that is, its value is a function of those other variables. If we choose a particular lens (a particular copy, if we wish), and (for a zoom lens) a particular focal length setting, then the modulation transfer ratio is a function of these variables:

• The aperture (as an f/number).

• The spatial frequency of the component of detail which we are interested in the lens' ability to preserve.

• The distance on the image from the optical axis to the point at which we are interested in the lens' behavior.

• Whether the detail of interest is oriented in the sagittal or meridional direction.

We might aptly call that relationship the modulation transfer ratio function, but in fact a slightly shorter name was adopted, the modulation transfer function (MTF).

But, like our imaginary (and hyper-nerdlisch) scientific author in the warehouse temperature metaphor, the term "MTF" is used to mean any of three different things:

a. The variable of interest (the modulation transfer ratio).

b. A value of the variable (of the modulation transfer ratio) under certain conditions.

c. The way the variable (the modulation transfer ratio) varies with the controlling variables (listed above).

We see usage "a" when we see the vertical axis of an MTF plot labeled "MTF". (It is the axis of the modulation transfer ratio.)

We see usage "b" when read the "the MTF at this a spatial frequency of 30 lp/mm, at the center of the image, for sagittal detail, is 0.8". (That is, for those conditions, the value of the modulation transfer ratio is 0.8.)

We see usage "c" when we read, "Figure 4 shows the MTF of that lens". (That is, it shows how the modulation transfer ratio varies with values of the controlling variables.)

Now, there is nothing new here. My only point is to help us understand why, in reading about MTF matters, it sometimes seems that "MTF" refers to one kind of thing and other times to another kind of thing. That's because it does.

Best regards,

Doug
 
Top