• Please use real names.

    Greetings to all who have registered to OPF and those guests taking a look around. Please use real names. Registrations with fictitious names will not be processed. REAL NAMES ONLY will be processed

    Firstname Lastname

    Register

    We are a courteous and supportive community. No need to hide behind an alia. If you have a genuine need for privacy/secrecy then let me know!
  • Welcome to the new site. Here's a thread about the update where you can post your feedback, ask questions or spot those nasty bugs!

The antialiasing filter

Doug Kerr

Well-known member
Most digital cameras have, in front of the sensor array, a "spatial low-pass filter" often described as an "anti-aliasing" filter. There are a lot of misunderstandings about the role and purpose of this filter.

I will explain the concept in a different context - one in which the situation is clearer than in the digital camera case. Once the basic principle is in hand, the further complications of our situation can be better dealt with.

The context is the digital representation of an audio waveform. It begins with "sampling" of the waveform. That means we capture the instantaneous value of the source waveform repetitively, at a rate of fs (the sampling frequency). These values are then represented in digital form and stored, sent to a distant point, or such.

The Nyquist-Shannon sampling theorem tells us that, if we sample a waveform at a rate fs, and if all the frequency components of the waveform have frequencies less than fs/2, then from the suite of sample values we can reconstruct the original waveform. Not a close approximation of it, but precisely the original waveform.

Note at this point that to actually achieve this, the values of the samples must be preserved "precisely". That is an issue unrelated to the topic of this note, although important in the entire story of digital representation of audio waveforms.​

The frequency fs/2 is called the "Nyquist frequency" of the particular sampling scheme.

Now suppose we present to the sampling stage of our digital system a waveform that has a component at a frequency of greater than fs/2. (The case where it is exactly the same is harder to visualize, so I just will not allow it at this point.)

What happens to this component when we attempt to reconstruct the source waveform from the suite of sample values? We have been warned by Nyquist and Shannon that it will not be handled properly (that is, we were told not to have any such). Is is just missing from the reconstructed waveform? No, much worse.

In the reconstructed waveform there will be a component, with frequency less than fs, that was not in the source waveform at all - a spurious component. Not good.

To make the particulars most clear, let's use a numeric example. Suppose fs is 8000 Hz (that is, we sample the source waveform 8000 times per second, at intervals of 125 us). Thus, the Nyquist limit is 4000 Hz: we can only expect proper behavior for a source waveform all of whose components have frequencies less than 4000 Hz.

But suppose that we somehow submit to the system for digital representation a waveform that has a component at 4500 Hz.

When we try to reconstruct the source waveform by processing the collection of sample values, we will get a waveform that includes a component with frequency 3500 Hz. That frequency is as far below the Nyquist frequency as the "rogue" component was above it.

How does this happen? Well, we find that is we sample a 4500 Hz test waveform at 8000 times per second, the sequence of values is identical to that we get if we sample a 3500 Hz waveform at 8000 times per second.

What does the "decoder" do with that? Well, if it "understood the theory", it would "know" that this sequence of sample values could come from a source component at 3500 Hz, or 4500 Hz, or in fact at an infinity of higher frequencies. So what should it do?

Well, the decoder's designers "told" the decoder it was operating in a context where no component of the waveform should exist at or above 4000 Hz. So its action is to decode that sequence of sample values into the only legitimate component they can come from: 3500 Hz.

One way to look at this is that our rogue component (at 4500 Hz) travels with the appearance of a legitimate 3500 Hz component - that is, travels under a false identiy, under an alias.

Thus, one name applied to the fact that the reconstructed waveform contains a spurious component is aliasing.

The audible result is that the reconstructed waveform is not the same as the one we wanted delivered - it is corrupted. How do we prevent this?

"Doctor, doctor, when I do this my elbow hurts!"

"Well, then don't do that."​

The solution is quite direct. We place in the path of the incoming waveform a low-pass filter that blocks all frequencies at or above 4000 Hz. Then, no "rogue" components will be present at sampling. They are indeed left behind at the vestibule.

But of course we can't construct a filter that cuts off suddenly a tiny distance below 4000 Hz. If we could, it would have undesirable side effects.

What we do is use a sampling rate of 4000 Hz in a system that will only be used to store or transport audio waveforms with components up to perhaps about 3500 Hz. Then we have from just above 3500 Hz to just below 4000 Hz for our low-pass filter to "roll off" in its response.

That low-pass filter is sometimes called an "antialiasing" filter.

What happens if we leave it out. We have the phenomenon of aliasing, and the reconstructed waveform is different from the original one we aspired to transport, often in a very troublesome way. It may sound really lousy, owing to components that aren't even related harmonically to the fundamental frequency of the original audio signal.

Well, can we take care of that later in the system? No, not really. The actual precise composition of the original waveform has been lost forever. There are of course extremely complex ways (practical with today's signal processing power) to partially suppress the audible symptoms, but they do not result in our getting back a "precise" reconstruction of the original audio waveform - just one that "sounds about the same". If the audio message is just Aunt Martha complaining about Cousin Mae, that will be fine. If it's a symphony concert on its way from the studio to the transmitter (we'll imagine a system designed with a higher sampling rate), not so fine. If it is an encoded telemetry message, not worth a damn.

Now, as I mentioned, in the digital image situation, the very same principle pertains, but with some complications. I'll go there in part 2 of this series.

Best regards,

Doug
 

Cem_Usakligil

Well-known member
A ha! I have been waiting for an article on antialiasing filters for some time! Can't wait to read the part 2. Thanks for doing this for all of us.
 

Doug Kerr

Well-known member
[Part 1.1]

Before I embark on part 2, in which I will slide from the world of digital audio into that of digital photography, let me discuss an issue that, once we get to the digital photography realm, will no doubt be of interest.

Does the introduction of the antialiasing filter into the digital audio system I described above compromise the frequency response of the whole system?

Well, if we had no antialiasing filter, we could perhaps reliably transmit components up to, say, 3950 Hz through our digital audio system with fs=8000 Hz.

But with the antialiasing filter in place, perhaps the system response at 3950 Hz would be down by 15 dB.

Perhaps the point at which system response would be down by 3 dB (one possible criterion for scoring its maximum frequency capability) was 3600 Hz. And so we "advertise" its response as being up to 3450 Hz.

So then, would be be better off with the filter gone?

Only if we were willing to deliver a badly-corrupted waveform in the case that the incoming signal had substantial components above 4000 Hz.

If this was in a telephone network, where would such a signal come from? Well, right out of the telephone set.

But we sometimes hear that nothing above about 3450 Hz comes out of a telephone set.

But that's not true. It's just that we don't aspire to transport any components higher than about 3450 Hz through the network (for historical reasons). Yes, the response of the transmitting side declines as frequency increases. But there can very well be substantial power above 4000 Hz.

But doesn't the line from the subscriber's location to the serving central office cut off at about 3500 Hz?

No, not usually. Its frequency response just drops slowly with frequency. We actually use this very kind of line for high-speed digital transmission with subcarriers at frequencies up to over 8 MHz.

So, yes, there can be "rogue" components at the entrance to the digital transmission system. And yes, we need to have the antialiasing filter in place.

Could we design one that would have a steeper cutoff and squeeze a little more frequency response out of the system? Sure.

Best regards,

Doug
 

Jerome Marot

Well-known member
I don't think that the "anti aliasing filter" used in a digital camera deals with the same problem than the one in an audio recorder.

Its frequency is far higher than Nyquist. Take as an example the Nikon D3x, it has a frame size of 6000 x 4000. That means on the picture height, we have 4000 pixels. Nyquist is thus 2000 cycles (line pairs) per picture height. However, that same camera is measured at 2700 line pairs per picture height, on dpreview.

The manufacturer of dpreview test software, imatest, makes it clear here under the heading "Summary of Spatial frequency units" that dpreview indeed uses line pairs per picture height.

The cameras are undersampled and indeed some artifacts are visible. The same was the case for analog video, there was no anti-aliasing filter at all and the bandwidth was about 75% of the sampling frequency (compared to Nyquist which is 50%). This 75% figure used to be called the "Kell factor". If the 24 Mpix D3x was sampled to Nyquist, the result will fit in a 6 Mpix array.

The anti-aliasing filter in digital camera is there because of the Bayer array (and indeed it is not use on cameras which to not use a Bayer array: B&W CCDs or Foveon sensors). It just spreads a little bit the image on adjacent sensels (which sample different colors) to avoid color moiré on fine black and white details.
 

Doug Kerr

Well-known member
Hi, Jerome,

Take as an example the Nikon D3x, it has a frame size of 6000 x 4000. That means on the picture height, we have 4000 pixels. . . . However, that same camera is measured at 2700 line pairs per picture height
Not believable. That suggests that it could resolve 5400 "lines" (in the "TV" practice sense - both black and white lines counted) with 4000 rows of sensels.

Something must be confusing somebody here.

Indeed, we often see resolutions reported (in lines, not cycles) that are consistent with a Kell factor of 70-75% times the pixel count (just the way it worked in Kell's day!).

The data you give above suggests a Kell factor of 1.35.

I prefer to speak in terms of cycles.

Best regards,

Doug
 

Doug Kerr

Well-known member
My apologies for not having yet posted (written!) part 2 of this series - some unexpected imperatives came up.

Soon.

Best regards,

Doug
 

Doug Kerr

Well-known member
Hi, Jerome,

It appears that the resolution test chart used by dpr is notated in terms of lines per picture height (lines in the "TV practice" sense: on a test chart, black and white "lines" are counted separately). At the "6" point on the "fountain" resolution pattern ("600 somethings"), the pitch from one black line to the next is about 1/293 of the standard picture height.

The resolution figures cited on screen 32 of the Nikon D3X review seem to be in those terms.

The review cites the "absolute" resolution in the vertical direction to be 2600 "LPH". The "LPH" value is consistent with the scale on the chart (in hundreds of lines per picture height, in the sense of "lines" I mention above).

With a sensor vertical dimension of 4032 sensels, that would be consistent with a perfect optical system, sensor, and demosaicing process and a Kell factor of 0.64.

I have to look at the dpr "FAQs" regarding testing to see what they say about this.

All fits for me.

Best regards,

Doug
 

Doug Kerr

Well-known member
[Part 2]

Now we will transition from the sampling of an electrical waveform situation to the sampling of an optical image. To make the initial transition easier, I will eliminate for the moment a number of very important special complications of the image situation:

• I will assume a monochrome camera, so for now we need not encounter the concept of a CFA array and demosaicing.

• I will assume that each sensel of the sensor senses the luminance of the image only at a point (not an average over the intake area of the sensels' microlens).

In the electrical case, we dealt with temporal (time-based) frequency, denominated in cycles per second (for which of course there is a special name, hertz). Here we will deal with spatial (distance-based) frequency. It is denominated in cycles per some unit of distance; thus it could be in cycles per inch, or cycles per millimeter. But it will help our future work here if we use as the unit of distance the height of the entire image, so frequencies are denominated in cycles per picture height (cy/PH).

Now, as a further simplification for the moment, consider only a tiny vertical stripe of the image, lying on a vertical column of sensels. There is a "profile" of illuminance along that stripe, which is the analog of a piece of an electrical waveform.

The sensels read the value of that illuminance profile at a regular interval, not of time but of distance along the "column". So we see the direct parallel with the case of time-periodic sampling of an electrical waveform.

If our sensor has 4000 sensels in a column, then the sampling frequency is 4000 cycles/PH. Thus the Nyquist frequency is 2000 cy/PH.

Then, as predicted by the Shannon-Nyquist sampling theorem, if all components of the illuminance profile have (spatial) frequencies less than 2000 cy/PH, then from the suite of 4000 sensel values the entire illuminance profile can be precisely reconstructed.

But what if there are components whose frequencies are 2000 cy/PH or higher. Then we will have aliasing. Let's examine this with a specific "scene" case.

Our scene will be a parallel line test chart with 700 horizontal black line, white line pairs over the entire picture height. The black-white boundaries are "sharp".

Then what spatial frequencies would be contained in the illumination profile along a "column" of the image of this chart on the sensor (done with a lens of unlimited resolution)?

That profile would contain frequency components at 700 cy/PH, 2100 cy/PH, 3500 cy/PH, 4900 cy/PH, and so forth - that is, a fundamental (at the same frequency as the "frequency" of the line pairs) plus components at all odd multiples of that (the odd harmonics). Let us for the moment only think of the 700 cy/PH and 2100 cy/PH components - pretend the others don't exist.

Now, the Shannon-Nyquist sampling theorem tells us that the collection of 4000 sample values will properly describe all components whose frequencies are less than 2000 cy/PH - that is, in this case, the 700 cy/PH component.

But that suite of values will also seem to describe a component at 1900 cy/PH. (Just how that happens is a story for another time.) It comes from the 2100 cy/PH component in the original illuminance profile - its apparent frequency implied by the samples is as far below the Nyquist frequency as its "source" was above the Nyquist frequency.

If we reconstruct the luminance profile apparently described by the 4000 values (say, when displaying the image), it will contain components at 700 cy/PH and 100 cy/PH. This is of course a different profile than we were trying to convey. In other words, the illuminance profile implied by the sample values has been corrupted, by aliasing.

If we now do this for all vertical "columns" of our test chart image (perhaps there are 6000 of them), and then reconstruct the (corrupted) image apparently described by all these 24 million samples, what will it look like? Well, in many cases, it will have moiré!

[to be continued]
 

Doug Kerr

Well-known member
[Part 3]

How can we prevent this aliasing - prevent the "corruption" of the reconstructed illuminance profiles (that is, of the reconstructed entire image)?

We need to "strip out" of the image headed for the sensor all frequency component at or above the Nyquist frequency (2000 cy/PH in the example). We need an optical low-pass filter. Just what might that be?

Let's go back to the electrical case, and consider a low-pass filter we might use for the same purpose. If we submit to this filter a very short pulse (theoretically, one with zero length but still containing finite energy), a certain waveform will come out of the filter. The shape of that waveform is determined by the frequency (and phase) response of the filter. From the shape of that waveform, we can determine precisely the shape of the frequency response curve (and phase response curve) of the filter by Fourier analysis.

Now back to the optical realm. Is we pass a cone of rays (for example, from a camera objective lens), one that should form a point image (the optical equivalent of a "zero-duration pulse) on the sensor, through a certain kind of optical doodad on its way to the sensor, the image that will be formed on the sensor will not be a "point" but rather a circular "blur figure".

The illuminance profile across a diameter of the blur figure (the famous "point spread function" of the doodad) is exactly equivalent to the output waveform of an electrical filter driven by a zero-duration pulse.

If that profile is like the electrical waveform from a low-pass filter, then that means that the optical doodad is an optical low pass filter. If we have it in place when the lens forms a "normal" image (of some scene), the doodad will strip out of the image all the components above a certain spatial frequency.

And if that "cutoff frequency" is lower than the Nyquist frequency of our sampling scheme, there will be no components left that will cause aliasing; we have prevented aliasing, and the image corruption (often manifesting as moiré) that it causes.

And that doodad is our antialiasing filter.

Now, there are many fascinating further parts to this story, But I think that's enough for one day. (I dunno about you guys, but I am pooped!)

Best regards,

Doug
 

Jerome Marot

Well-known member
Hi, Jerome,

It appears that the resolution test chart used by dpr is notated in terms of lines per picture height (lines in the "TV practice" sense: on a test chart, black and white "lines" are counted separately). At the "6" point on the "fountain" resolution pattern ("600 somethings"), the pitch from one black line to the next is about 1/293 of the standard picture height.

You are right and I was confused by the Imatest reference.

Still: the low pas filter is present to avoid color artifacts coming from the Bayer array. The non Bayer sensors do not use a low-pass filter. The artifacts they produce are not noticeable in practice.
 

Doug Kerr

Well-known member
[Part 4]

So far, to avoid certain complications, I have assumed a monochrome camera. Now I will embrace the realities of a "color" camera.

As a first step, assume a camera with a true "tricolor" sensor or equivalent (such as a "three chip" video camera, or a camera with a "Foveon" sensor.

The concept of aliasing, and of its mitigation with an optical low-pass filter, are no different here. The samples now are suites of three values, rather than just a single value for illuminance, but nothing else changes.

Most cameras "we" are dealing with have color filter array (CFA) sensors (often, but not always correctly, called "Bayer" sensors, since in most, but not all, CFA sensors the nature and layout of the several different types of sensels follows the "Bayer" pattern).

The implications of aliasing are somewhat more complicated here, and I in fact am not fully conversant with all the details (for which the reader may feel grateful).

First, we may consider the actual image formed by the lens as having three "layers", each corresponding to the aspect of the light to which one of the three types of sensels ("R", "G", and "B") is sensitive.

Of course, to actually "capture" the image, we would like to know the "value" of all three layers at every point across the image. That of course would be an infinite amount of information, so even if we could capture it, we could hardly deal with it.

Thus, led by the work of Messrs. Shannon and Nyquist, we choose to sample each of these layers at periodic intervals across the entire frame. Now there are two details of importance here:

• We sample the "G" layer at twice as many locations across the frame as the other two layers. (That suggests that somehow the Shannon frequency for it is higher than for the other two layers, although in this two-dimensional situation it is a little hard to grasp just how to define that.)

• The three sample patterns are not aligned but rather are staggered.

To help understand the latter situation, I will return to the world of digitizing an audio signal. Imagine that we have a stereo audio signal, with each channel containing components up to about 3500 Hz. (Yes, that's very low, but this lets me conserve some numbers from earlier in this article!)

We decide to sample at a rate of 8000 samples per second (we can say 8000 Hz). But we have only one sampling organ, so we do it in a staggered way. That is, we take a sample of the instantaneous value of the L channel. Then, 62.5 us later (half the sampling "period" of 125 us), we take a sample of the R channel. Now the 8000 samples we take of the L channel in a second completely describe the L channel waveform (assuming that it has no components at or beyond 4000 Hz); the 8000 samples we take of the R channel in a second completely describe the R channel waveform.

If we had only one of these channels (a monaural signal), it would not matter at exactly what time phase we sampled it, so long as it was done at a uniform rate of 8000 times per second. Thus it is of absolutely no consequence that (to save hardware), we sample the two channels on a "staggered" pattern. We end up with a full, precise description of each channel's waveform.

A simplistic view of the operation of a CFA sensor follows that same outlook. Let me forget the "G" sensel array for a moment, and consider only the "R" and "B" arrays. Each samples its assigned "layer" of the image at regular intervals of distance in both vertical and horizontal distances.

If we have 2000 sensels in the total height of the sensor, then for either the "R" and "B" arrays, the "sampling frequency" (in each direction, V or H) is 1000 cy/PH. Then, with respect to either of the corresponding layers, the Nyquist frequency is 500 cy/PH.

If the pattern of one of those layers contains components at or above 500 cy/PH, there will be aliasing, and the suite of values for that layer (all the "R" values, for example) will describe a layer that contains components not actually present in the layer itself. That is, the description of the layer, through samples, is corrupted by aliasing.

The result is that the "reconstructed" layer (if examined alone) would perhaps exhibit moiré patterns, and thus in the complete color image, we may see "color moiré" patterns.

Now if life were really that simple, it would seem that to avoid aliasing here we would have to equip the camera with an "optical low-pass filter" that would strip from the image all components whose spatial frequencies were at or above 500 cy/PH.

This would lead to a camera whose resolution at best would be half the resolution implied by the sensel pitch, further diluted by the Kell factor and other considerations (probably leading to a resolution of perhaps 35% of that implied by the overall sensel pitch). And we know we do much better than that (perhaps a resolution of 65% of that implied by the sensel pitch, as in the case of the Nikon camera Jerome mentioned earlier in this thread).

How can this be?

The answer is that our CFA cameras do not interpret the large suite of data from the the sensel groups by independently reconstructing the three layers from their respective suites of sensel data. Rather, extremely sophisticated "demosaicing" algorithms, exploiting the realities of how the colors in an image typically change over a small area, are able to reconstruct approximations of the three layers with resolutions corresponding to the overall sensel pitch. (Yes, we do not get a precise color description of the image in our CFA cameras, folks.)

Now, what does this mean about our antialiasing filter. Well, it means that if we naïvely seek to prevent aliasing on each of the layers with a simple optical low-pass filter, we will frustrate the camera's CFA system from "wringing out of the suite of sample data" three reconstructed high-resolution layers.

The theory of the solution is a bit beyond the scope of this article (meaning, a bit beyond me). In one approach, conceptually the antialiasing filter used in sophisticated CFA cameras does not have a symmetrical blur function. Rather, when we send it a cone of rays that, left alone, would focus at a point on the sensor, it delivers four little cones of rays, spread so that if one of them would focus at a point on one sensel of a sensel "quad", the other three would focus at points on the other three sensels of the quad.

And that's about as much as I am able to explain about that particular matter! (Rastislav Lukac discusses it nicely in section 4.3 of his book, Single-Sensor Imaging: Methods and Applications for Digital Cameras, but I haven't really read it yet!)

A little reflection

It is often said that the only reason we need to think of using an antialiasing filter in a digital camera is if it uses a CFA array, to avoid "color moiré" effects. But (as hopefully you have come to appreciate from the foregoing discussion), that's not true.

So suppose we had a color camera with a "true" tricolor sensor (such as a Sigma with a Foveon sensor). Apparently many (or all) of these do not have an overt antialiasing filter, and a popular story is that there are no aliasing artifacts. (The story is often presented as "there is no color moiré", not quite the same thing.)

In fact, I have seen references to studies that show the presence of aliasing artifacts in the images from certain such cameras. The scale of the artifacts is apparently very small, and so they are not general considered as "intrusive". (I have not yet had a chance to read these study reports myself.)

Keep in mind that, using our simplistic view of the operation of a CFA camera ("three layers sampled at a low rate"), the Nyquist frequency for a CFA camera is about half that for a tricolor sensor camera with the same sensel pitch. Thus the antialising filter that would be optimal for a tricolor camera would have a higer cutoff frequency than the one for a CFA camera (if it were of the simplistic type).

We also need to keep in mind that none of our lenses, treated as optical filters, have an "infinite cutoff frequency" (a matter we investigate through the concept of the modulation transfer function for a particular lens).

So, on our Sigma "Foveon sensor" SLR, we do have an antialiasing filter? Yes - It is the lens.

Does it in all cases completely free us from aliasing artifacts? Evidently not.


Best regards,

Doug
 

Doug Kerr

Well-known member
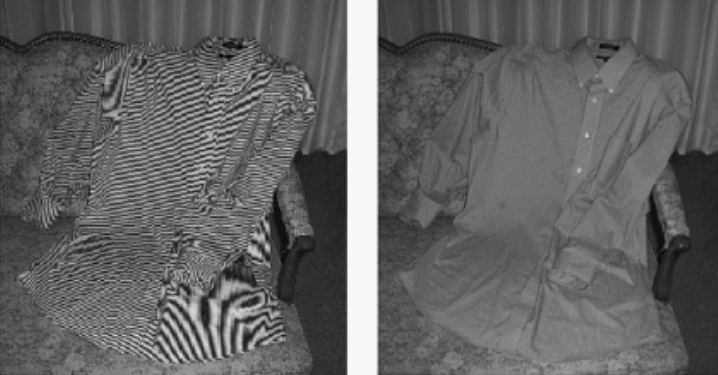
I hope to be able soon to present some good visual examples of the impact of aliasing. For now, let me just present these, taken from Single-Sensor Imaging: Methods and Applications for Digital Cameras, by Rastislav Lukac. They present a rather extreme (but perfectly realistic) case.

Lukac_aliasing_01-03.gif


Credit: Rastislav Lukac: used under fair use doctrine​

The subject here was a shirt with very closely spaced stripes, whose fundamental frequency in the image was well above the Nyquist frequency for the sampling system used to capture the image (that is, the digital camera sensor array).

On the left we see the image sampled by that digital sensor array with no "bandlimiting" applied to the image before sampling. We see rather bizarre aliasing artifacts.

On the right, we see the result when the image is spatially bandlimited to frequencies below the Nyquist frequency before being sampled by the digital sensor array (at the same sampling rate as before). Indeed, the fine stripes are not resolved at all.

Of course, if we feel cheated by the loss of viability of the stripes caused by the filter, we could remove the filter and revert to the left-hand image as our "deliverable"

I have no details as to the sampling rate involved here, or the nature of the filter used in the second case.

Note that this is a strictly monochrome camera situation. There is no issue pertaining to the use of a CFA sensor array and demosaicing, no issue of "color moiré".

I believe this speaks for itself.

Best regards,

Doug
 

Jerome Marot

Well-known member
Indeed the image you cited is a pathological case, with a sensor sampling frequency far below the passband of the lens, and very fine details. In practical photographic use, this phenomenon is extremely rare and limited to small zones. 3CCD video cameras, foveon sensors and black and white sensors usually avoid using an anti aliasing filter and no problems are noticed in practice.
Such is not the case in bayer sensors. The ones which do not use an anti aliasing filter frequently exhibit noticeable color artifacts.
 

StuartRae

New member
Another question we must ask about this example is how much the problem has been exacerbated by down-sampling. I've seen images where aliasing artifacts are absent at 100%, but become a real problem when the image is down-sampled (depending on the method used) for screen display.

Regards,

Stuart
 

Bogdan Hrastnik

New member
Hi Doug,
Very well written article (as always). And speaking for me, it was a good idea you have started with audio signals -otherwise, I'm not sure if I would understand a thing :)
And even now, I would welcome some shematics images "explaining more than thousands words" (you now, for case, like: somethimes, we only "think", we understand). This is only a suggestion in case, you're planning to publish that on "pumpkin".
Thank you for good reading.

Bogdan
 

Doug Kerr

Well-known member
Hi, Bogdan,

Hi Doug,
Very well written article (as always). And speaking for me, it was a good idea you have started with audio signals -otherwise, I'm not sure if I would understand a thing :)
And even now, I would welcome some shematics images "explaining more than thousands words" (you now, for case, like: somethimes, we only "think", we understand). This is only a suggestion in case, you're planning to publish that on "pumpkin".
Indeed.

Thank you for good reading.
Thanks so much.

Best regards,

Doug
 

Doug Kerr

Well-known member
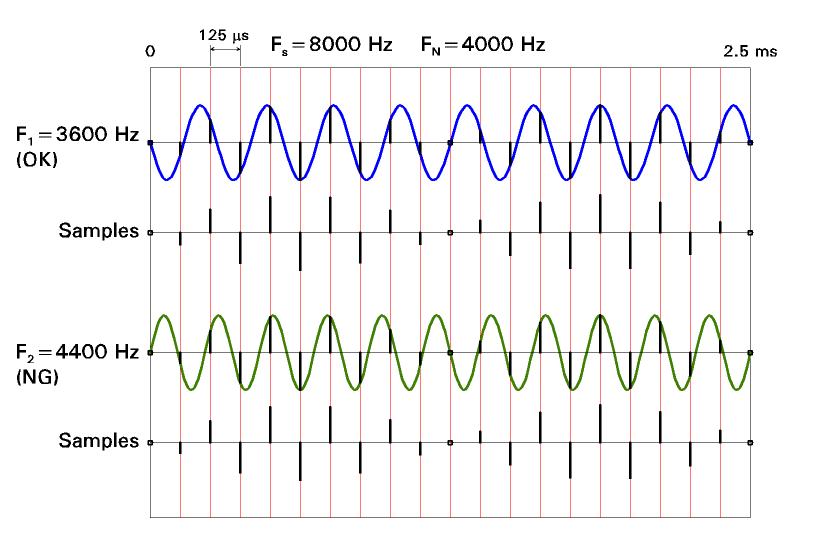
The mechanism of aliasing is often hard to grasp. This figure may give some insight into it.

aliasing-01.gif


Rather than an example with spatial frequencies in an image (our real interest), I use here an example with temporal frequencies in an electrical waveform. The theoretical principles are essentially identical, and this context allows me to avoid some pesky considerations (such as that the image is two-dimensional).

The model here is of the sampling of an audio waveform, as the first step of preparing to transmit the waveform in digital form.

We want our system to be able to transmit frequencies up to about 3700 Hz. So we choose a sampling frequency, Fs, of 8000 Hz (8000 samples per second). The Nyquist frequency for that (FN) is 4000 Hz, so there should be no problem from aliasing with signal components at frequencies up to almost 4000 Hz.

We have however (imprudently) included no bandlimiting ("antialising") filter in the system.

The red lines show the sampling instants. With the sampling rate being 8000 Hz, they are 125 us apart in time. We see an overall span of 2.5 ms on this figure.

We will test the process with a very simple signal, a sinusoidal waveform with one component, at 3600 Hz. We see it as the blue waveform in the upper part of the system. It is of course within the Nyquist limit, so it is a "legitimate" candidate for "capture and transport" by way of samples at 125 us intervals.

The black bars overlaid on the green curve are construction lines to show the instantaneous value of the waveform at each sampling instant.

The height of the bar is the sample value for the particular sampling instant. Where that value is zero, I have a little open circle instead of a bar.

Just below the panel with the blue waveform, I have reproduced the set of bars. We can think of this as the suite of sample values for the 2.5 ms interval we observe here. In an actual digital system, they would be represented numerically in digital form, but it is only the values that matter to the issue at hand, so the graphic presentation of those (as the heights of bars) will be fine for us.

In the next panel, we see another simplistic test signal, this one comprising a single component, with frequency 4400 Hz (the green waveform). Since its frequency is not less than the Nyquist limit, this is a "rogue" component. We should not be attempting to capture and transport it (we should have filtered it out with an antialiasing filter, but we assume there is no such).

Again, we find the waveform instantaneous values at each sampling intervals with construction lines, and then duplicate them below so we can see the suite of sample values.

Well, guess what - this is the same set of sample values we got from the 3600 Hz test signal.

So we see that the suite of sample values, in a system with a Nyquist Frequency of 4000 Hz, from a signal at 3600 Hz and one at 4400 Hz are the same (and there in fact are many higher frequencies that would also yield the same suite of sample values. So clearly there is an ambiguity in the "description" carried by this suite of sample values.

Now at the time and place we aspire to reconstruct the original waveform from this suite of stored or transmitted signal values, what does the "decoder" do? Does it make a 3600 Hz sine wave, or a 4400 Hz sine wave, or one of the other possible progenitors of this suite of sample values?

In effect it has been "told" in its design to interpret any suite of samples as representing a waveform all of whose components are below the Nyquist frequency established for this system, which is in this case is 4000 Hz.

Actually, the way the "decoding" works ends up with a filter that will only pass components below that frequency - the "reconstruction filter". But how that works is a story for another day.​

So the "decoder" dutifully generates a sine wave with a frequency of 3600 Hz.

There's only one problem - that was not the frequency of the original waveform - that was 4400 Hz.

Suppose that the 4400 Hz waveform was only one component in a complex audio waveform (human speech, for example). Now, the "delivered" waveform will have a component at 3600 Hz, which doesn't belong there in any way. The signal is corrupted, and will probably sound very peculiar. Not because the 4400 Hz component of the original speech signal has been lost - there were probably many higher frequency components in the actual acoustic speech which were lost in the microphone chain. But because it was replaced with a "bogus" component, one probably not harmonically related to the fundamental frequency of the speech waveform (and thus not a legitimate component of it, even a slight different form of it).

And that's why, gang, essentially the first block in a digital audio transmission or recording chain is a low pass filter - the antialiasing filter.

Best regards,

Doug
 

Doug Kerr

Well-known member
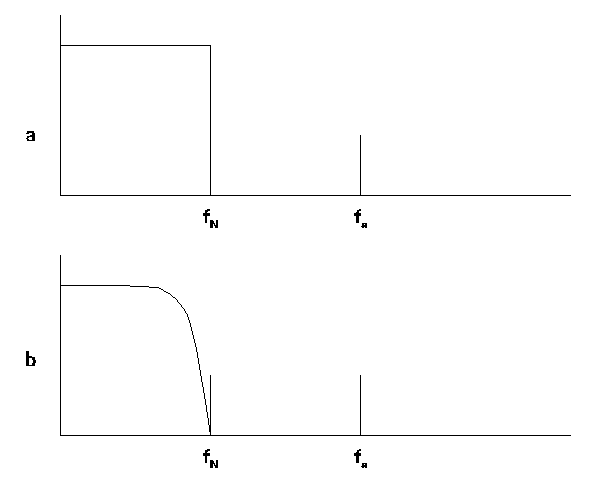
I thought I would talk a little about realities of the anti-aliasing filter in modern digital cameras. We'll start on this figure.

Think first of the situation in which we are sampling (in time) an electrical waveform. To avert aliasing, we put ahead of the sampling stage a low-pass filter, essentially cutting off at the Nyquist frequency, fN. This is of course half the sampling frequency fs.

We are tempted to think we would like one with a frequency response as shown in panel a of this figure - a "brick wall" low pass filter.

cosxsinc_01-1.gif


But it is almost impossible to physically build such a filter, and if we could, we'd be sorry - it would unavoidably have various unattractive side effects (not because of defects in its operation but as a mandate of theory). So in reality we may use a filter with a frequency response as seen in panel b. In an electrical context, that is realistic to do.

So when we move into the optical realm, where we will be sampling, in space, an image, we at first think we should build an optical low-pass filter with a similar (spatial) frequency response.

But in the optical context, doing so is essentially impossible.

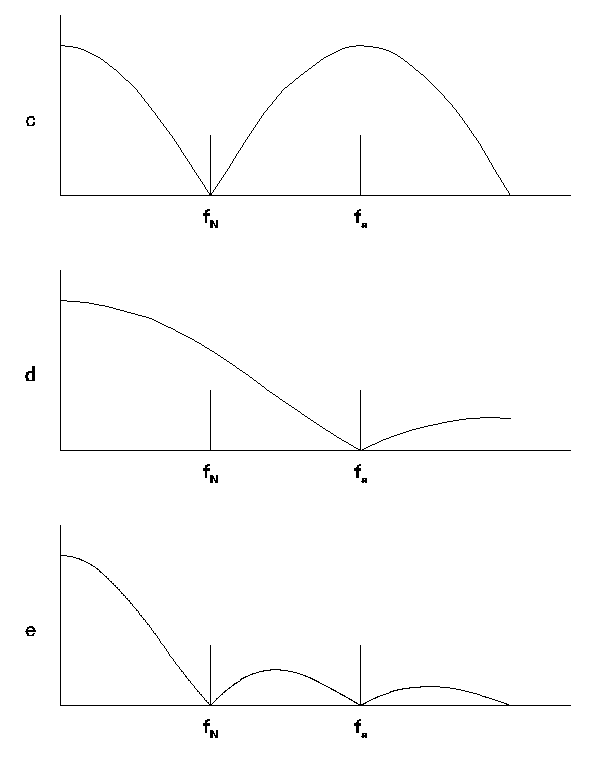
Instead, in most digital still cameras, an anti-aliasing filter called a "four-spot" filter is used. As its name tells us, it takes very point of the image formed by the lens and blow it out into four very tiny (point-like) spots, arranged in a square. The distance between spots is often nearly the same as the spacing between photodetectors - sometimes exactly the same.

Now the real object of this filter is not really to put four duplicate spots on four adjacent photodetectors (although stories about that objective are common in the folklore). What is important is the (spatial) frequency response that "point spread function" represents. If in fact the distance between the points is exactly the spacing between photodetectors, that frequency response is theoretically that seen in panel c in this figure.

cosxsinc_01-2.gif


It actually, in theory, continues in the same pattern to infinite frequency; I have only shown part of it.

And this filter is what we call the anti-aliasing filter in such a camera.

Well, as a low-pass filter it is a bit of a flop. Yes, its response does fall to zero at the Nyquist filter (and thus it does eliminate a special type of "misbehaving" component in the image, one whose frequency is exactly the Nyquist frequency.

But beyond that frequency, the response rises briskly, opening the door to the retention of a wide range of aliasing-causing frequency components from the image.

So why do we use it? Well, we know how to make it!

But how can we tolerate its incompetent work as a low-pass filter? The answer is that we give it some help.

In my discussions of sampling, I have generally assumed that we we speak of determining the voltage of a waveform or the illuminance of an image at repetitive "points", we mean exactly that: we pick up the value at just a point.

But we know that our camera sensors don't work that way. The manufacturer intentionally makes each photodetector pick up light from as large an area as possible, in the interest of good noise performance. In fact, in the latest Canon sensors, the "intake area" of the detectors is almost as wide and high as the spacing between photodetectors.

Once we do that, the system behavior is as if we placed in front of the array of detectors a "blur filter" (with a square point spread function). And this is a certain type of spatial low-pass filter.

If indeed the intake area of the detectors is the entire area of the photodetector's "realm", that equivalent filter has the frequency response seen in panel d. (Again, it goes to infinity, this time diminishing as it goes, but again I have only shown part of it.)

So from a standpoint of the elimination of "aliasing-causing" frequency components of the image, it is as if we have a filter whose response is the product, at each frequency, of the response of the actual anti-aliasing filter (c) and the virtual filter that reflects the effect of a "large throat" photodetector (d). That joint response is shown on panel e.

Is that a desirable response for our real anti-aliasing filter? Well it's sure better than the one in panel c.

Now in fact there is further help for the hapless anti-aliasing filter, the frequency response of the lens,. It of course drops off with increasing spatial frequency (a matter we describe in terms of the MTF of the lens).

Now, unless the lens has way more resolution capability that can be exploited by our camera (nothing in this house!), the lens itself become part of the overall true anti-aliasing.

Now monochrome cameras, and color cameras using a true tristimulus sensor (such as the Foveon type), often "have no anti-aliasing filter" - that is, the don't have what we call the anti-aliasing filter.

Some commenters here have suggested that the reason this is tolerable is that the visible effects of aliasing (such as moiré patterns) only appear in a camera with a CFA (Bayer) sensor and demosaicing. But that is not so, although in fact the visible impact of aliasing is far more prominent in a camera with demosaicing.

In fact the real reason is that a camera "without an anti-aliasing filter" gets along (in addition to the greater tolerance to aliasing in a camera without demosaicing) is that it does have two of the three parts of the entire real anti-aliasing filter of a CFA camera: the virtual frequency response of the "large throat" photodetectors, and the "not infinite" resolution of the lens. It does have an anti-aliasing filter - we just can't find it on the parts list.

Best regards,

Doug
 

Doug Kerr

Well-known member
In a previous note, I pointed out that the "antialising filter" function in a digital camera is typically actually performed by a cascade of three "filters"

• The overt anti-aliasing filter (if present).
• The frequency response implied by the fact that the photodetectors have large intake areas (rather than being "point samplers").
• The frequency response of the lens.

I did not make a typical hypothetical response consolidating all three components (ran out of energy).

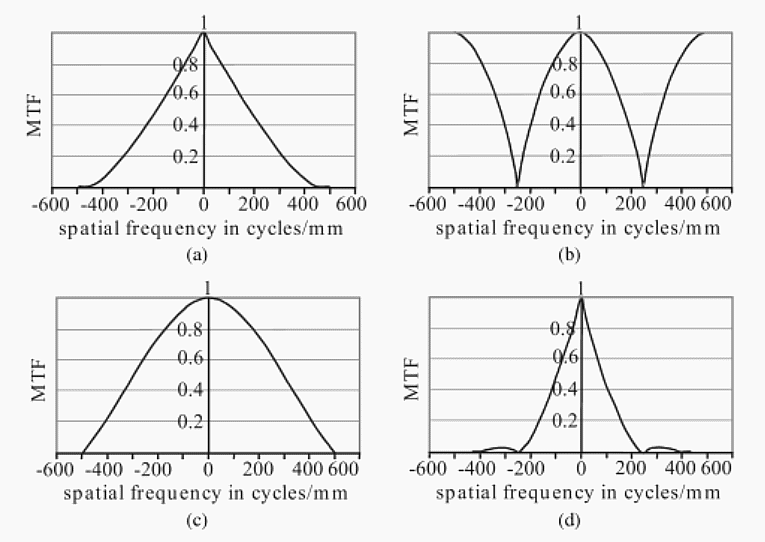
A nice figure in this regard appears in Single-Sensor Imaging: Methods and Applications for Digital Cameras edited by Rastislav Lukac, in Chapter 4 by Russ Palum. I present it here under the fair use doctrine.

Lukacs_fig_4.28-01.gif


The system here has a photodetector density of 500/mm; the Nyquist frequency is 250 cy/mm

Panel (b) shows the spatial frequency response (MTF) of a "four spot" filter with spot separation equal to the photodetector pitch (a typical "overt" anti-aliasing filter).

Panel (c) shows the spatial frequency response (MTF) implied by a photodetector intake area whose size is the full photodetector pitch.

Panel (a) is the spatial frequency response of some lens. Its MTF is about 0.3 at the system Nyquist frequency.

Panel (d) shows the consolidated spatial frequency response of the cascade of these three "filters". This is the actual effective "antialising filter response" of this setup.

Best regards,

Doug
 

Jerome Marot

Well-known member

You will notice that (a) and (c) are basically very similar, so that the combination of both will give a filter that is also similar to (a), just a bit steeper. Therefore, a camera devoid of the four-points filter will see some power above the Nyquist frequency (as is to be expected, since these cameras exhibit artifacts). This is also the case for Foveon sensors, the combination of the filtering action of the lens and sampling width is not sufficient as a filter.

Furthermore, I think that the null of the four points filter is a bit lower than the Nyquist frequency of the array in real cameras using a Bayer array, since the color artifacts produced by undersampling on a Bayer array happen for frequencies just below the Nyquist frequency of the array and the four point filter is there to avoid them.
 

Doug Kerr

Well-known member
Hi, Jerome,

You will notice that (a) and (c) are basically very similar, so that the combination of both will give a filter that is also similar to (a), just a bit steeper. Therefore, a camera devoid of the four-points filter will see some power above the Nyquist frequency (as is to be expected, since these cameras exhibit artifacts). This is also the case for Foveon sensors, the combination of the filtering action of the lens and sampling width is not sufficient as a filter.
A good point.

Furthermore, I think that the null of the four points filter is a bit lower than the Nyquist frequency of the array in real cameras using a Bayer array, since the color artifacts produced by undersampling on a Bayer array happen for frequencies just below the Nyquist frequency of the array and the four point filter is there to avoid them.

I hadn't realized that matter I have highlighted in blue. I will have to reflect on how that happens. (The whole situation of artifacts with the Bayer array is not as clear in my mind as I would like!)

But it may well be that four-point filters with the first null slightly lower then the Nyquist frequency are useful in practice. The case where the point spacing equals the sampling pitch is an arbitrary case that may in fact not represent typical design.

I've actually seen references to four-point filters in which the spacing was slightly less than the sampling pitch (so that the first null would be a little above the Nyquist frequency). I had always assumed that this was to provide more attenuation via the four-point filter itself for frequencies just above the Nyquist frequency.

Thanks for your observations.

Best regards,

Doug
 

Doug Kerr

Well-known member
Hi, Jerome,

Furthermore, I think that the null of the four points filter is a bit lower than the Nyquist frequency of the array in real cameras using a Bayer array, since the color artifacts produced by undersampling on a Bayer array happen for frequencies just below the Nyquist frequency of the array . . .

Is that due to the fact that these frequencies are "the farthest above" the effective Nyquist frequency corresponding to the actual sampling rate of any given color "layer"?

That is, is the reason they are the most troublesome is not that they are close to the Nyquist frequency of the consolidated array but just because their frequencies are "high"?

Best regards,

Doug
 

Doug Kerr

Well-known member
Hi, Jerome,

. . . since the color artifacts produced by undersampling on a Bayer array happen for frequencies just below the Nyquist frequency of the array . . .

Let me try and get an intuitive handle on that. I'll use fN to mean the Nyquist frequency of the image (that is, as determined by the photodetector frequency, which is the pixel frequency) and fn for the effective Nyquist frequency of the sampling of the "R" or "B" aspects of the image. (fn=fN/2)

The frequencies you speak of, just below fN, are at almost 2fn. With regard to the aliasing produced by the (under)sampling of an "aspect", they would produce a spurious component at a very low frequency (the source frequency would be "folded over" fn) in the apparent pattern of the "aspect" presented to the demosaicing algorithm).

Then is that low frequency component in the "aspect" pattern the basic genesis of the color artifacts that are of principal concern to us?

Now, consider a component in, say, the "B" aspect whose frequency is just above fn, say fn+ Dfn ("D" standing in here for "delta"). The set of "B" samples will appear to represent both that frequency and a spurious component whose frequency will be fn- Dfn. Those two together will appear to be a component with frequency fn modulated at a rate of 1/Dfn (the classical "beat pattern" phenomenon.

This would appear in the apparent pattern of the "B" aspect that is presented to the demosaicing algorithm for "intelligent interpolation".

Why would such a low-frequency "beat" pattern be less generative of color artifacts than a low-frequency spurious component?

Best regards,

Doug
 

Doug Kerr

Well-known member
Hi, Jerome,

I have recently revised my at-best-unclear model of the implications of sampling frequency and the like in the context of a CFA sensor system.

My previous outlook was essentially this:

In a CFA system, we sample each of three "aspect layers" of the image color with separate sets of photodetectors. For each, there is a Nyquist frequency (based on the spacing between photodetectors of that "class".

If there are frequencies in the "pattern" of a layer at or above the respective Nyquist frequency, then the continuous pattern of the layer implied by the set of sample values is erroneous, "corrupted" by the phenomenon of aliasing.

These three "inaccurate" portrayals are presented to the demosaicing algorithm, which seeks by "intelligent interpolation" to increase the resolution of the delivered image above the supported by the "layer" Nyquist frequencies.

The errors in the continuous patterns implies by the sets of samples (as a result of aliasing at the "layer" level) are exacerbated by the demosaicing process.​

Now, I think I would describe my outlook as this:

In a CFA system, we sample each of three "aspect layers" of the image color with separate sets of photodetectors. For each, there is a Nyquist frequency (based on the spacing between the photodetectors which sample that layer). If we are to avoid aliasing at this stage of the process, we would need to limit the frequency content of a layer to less than the corresponding Nyquist rate. That in turn would limit the resolution potential of the entire image.

However, the demosaicing algorithm attempts to estimate the values of samples, for each layer, lying between the actual samples taken for that layer by "intelligent interpolation" based upon the values of a cluster of actual samples (from all three layers) surrounding the point of interest.

That having been done (for better or worse), we have (for each layer) a representation by samples (both real and estimated) at a rate equal to the pixel rate of the delivered image.

For this there is also a Nyquist frequency, which (for the "R" and "B" layers) is twice that the rate mentioned at the outset. And the resolution of the image that would support is nearly that Nyquist rate.

Our need to avoid aliasing is now in terms of that (greater) Nyquist rate. Thus, to avoid aliasing, we only need to limit the frequencies in all layers of the image to be less than this Nyquist rate.​

Of course, this latter is consistent with the use of a four-spot filter (an overt antialising filter) with a spot spacing in the general area of the photodetector/pixel spacing.

Best regards,

Doug
 

Jerome Marot

Well-known member
Unfortunately, I can't really answer your question. The study of Bayer arrays is surprisingly complex and goes beyond my capabilities in mathematics. All I know is that the artifacts happen for frequencies just below the Nyquist frequency of the base array, but how their frequency power is distributed depends on the demosaicing algorithm used.
 

Doug Kerr

Well-known member
Hi, Jerome,

Unfortunately, I can't really answer your question. The study of Bayer arrays is surprisingly complex . . .
Indeed!

and goes beyond my capabilities in mathematics.
Moi, aussi!

All I know is that the artifacts happen for frequencies just below the Nyquist frequency of the base array . . .

Yes, and I search for a thought as to what uniquely "qualifies" them for this mischief.

One thought that comes to me is that frequencies just below the Nyquist frequency of the delivered image are the ones susceptible to causing display aliasing. (These components are below the Nyquist frequency but above what we might call the "Kell limit".)

Of course display aliasing is really a creature of the "resampling" that occurs when a digital image (with a certain pixel structure) is rendered by a display or printer with a certain pixel structure.

I wonder to what extent the aliasing artifacts that are troublesome to us are from this rather than aliasing in the sense we usually think of.

It would be interesting to know what happens to these artifacts when we render the image with a display or printer pixel rate that was (synchronously) an integer multiple of the image pixel rate (perhaps twice).

Well, I will be alert for information relating to that notion. As you well know, we read a lot of things that we may not pay attention to until we are "sensitized" by various intellectual exercises!

Best regards,

Doug
 

Jerome Marot

Well-known member
It is not display aliasing. That is quite easy to test on one of the pictures which exhibits color aliasing: just zoom larger than the pixel size.
 

Doug Kerr

Well-known member
Hi, Jerome,

It is not display aliasing. That is quite easy to test on one of the pictures which exhibits color aliasing: just zoom larger than the pixel size.
Sure.

I remain mystified as to why components in this particular range turn out to be particularly troublesome, but as you point out this whole matter is extremely complicated.

Best regards,

Doug
 
Top