Doug Kerr
Well-known member
In a number of recent discussions pertaining to aliasing in digital camera systems, I have paraphrased the Shannon-Nyquist sampling theorem thus (I will cast the paraphrase in terms of working with an electrical waveform):
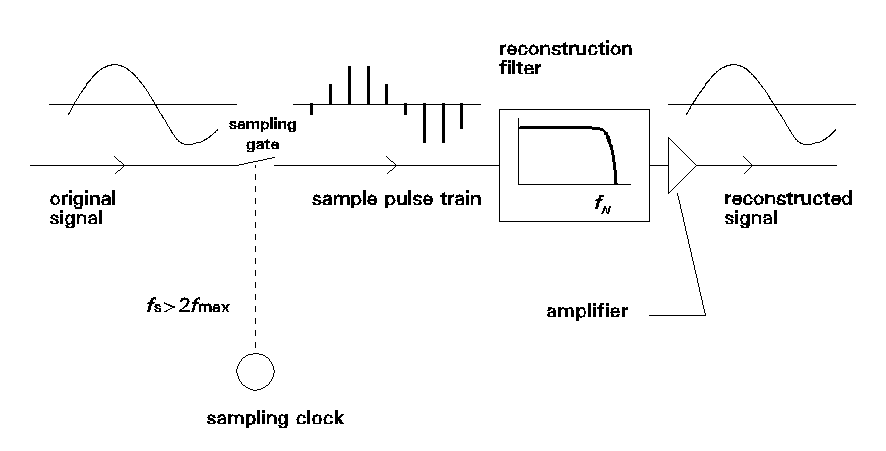
When we first hear this it may be hard to swallow. For example, how can the "reconstructing organ", even in theory, precisely determine what the voltage is at all the (infinite number of) points of the waveform between the sample points? Then, if we accept that this is theoretically possible, how can the "reconstructing organ" actually do that?
We will find that this story plays out well in the situation of a "signal" such as an electrical waveform (and audio waveform for example).
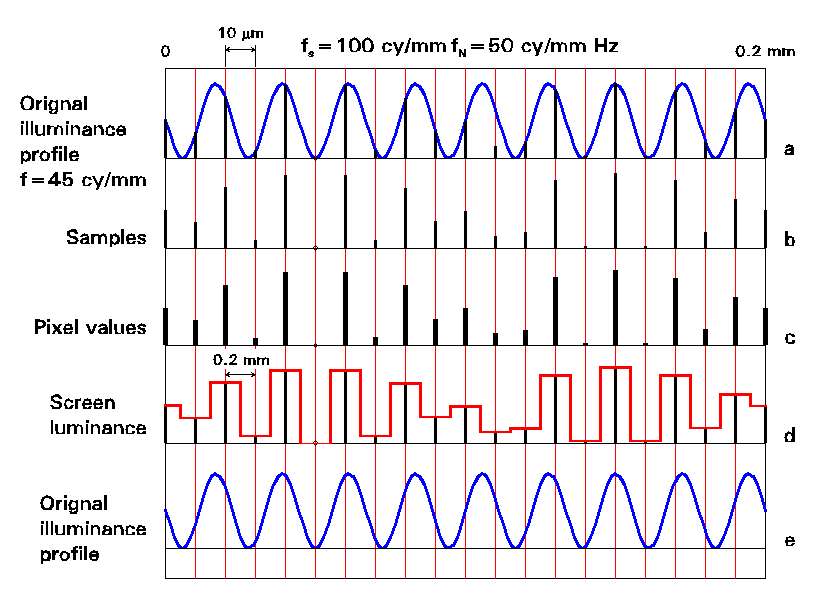
In a digital camera, we are also interested in completely describing a continuous "variable" through a finite number of samples. Here, the "variable" is the color of an image, which of course varies two-dimensionally across the image. The finite number of samples that we "deliver" are the colors of the pixels of the delivers digital image.
When we now look to find, in our overall digital chain, the equivalent of a certain critical feature of the reconstructing organ that we learned to appreciate in our work with an electrical waveform, we are unable to locate it. In fact, there is a a pivotal difference between the waveform and image cases (in actual practice) that influences how a digital system must be designed and how it will behave.
In this series of notes, I will take you through this story.
Reconstruction of a waveform from samples - a human simulation
I like to explain how reconstruction of a waveform can work through an exercise in which we simulate the workings of a sampled system using human actors.
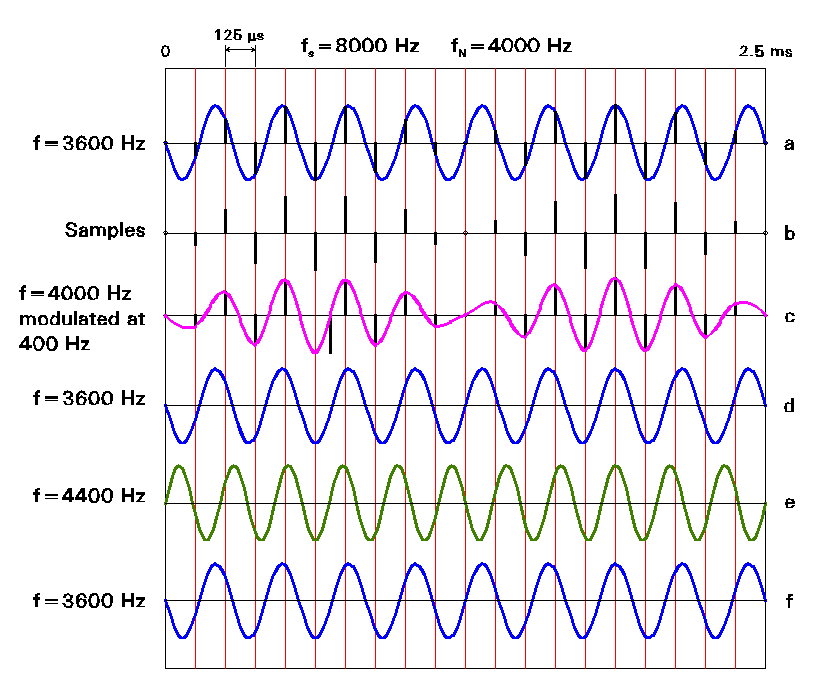
The system being simulated seeks to transport electrical waveforms containing components at frequencies no higher than 3800 Hz. Aware of the "rules" of Messrs. Shannon and Nyquist, we will sample the waveform at a rate of 8000 samples per second (8000 Hz). That is, a sample will be taken every 125 us.
Adam will play the role of the "sending" (or perhaps "recording") end of the system. I give him the waveform to be processed as a curve drawn on graph paper. The horizontal axis represents time and the vertical axis voltage. I take care that this waveform would only contain frequency components below 4000 Hz, the Nyquist frequency" for our sampling rate of 8000 Hz. That is, if we were to analyze the waveform by Fourier analysis, we would find in it only components whose frequency was less than 4000 Hz.
Adam begins his work by drawing vertical lines on the graph paper at intervals of (according to the time scale) 125 us. These lines represent the sampling instants.
Adam then notes the points at which the waveform intersects these lines and records on his log sheet the voltages at each of those intersections. These are of course the sample values (which are in terms of voltage).
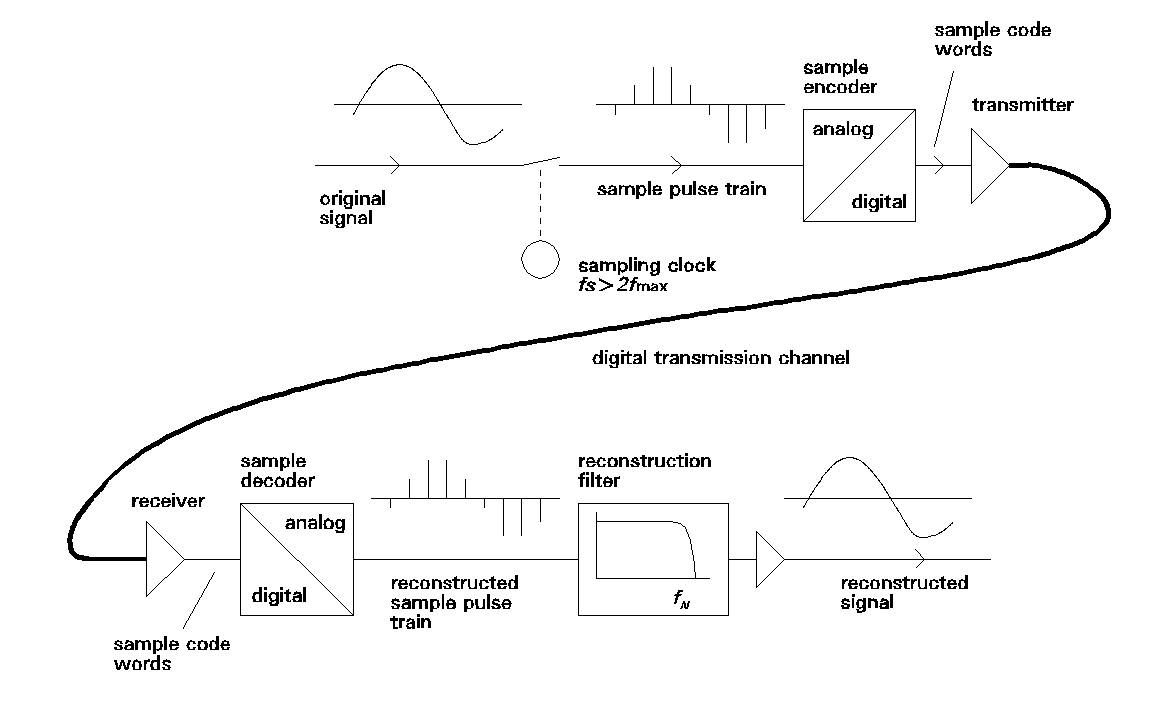
Hen writes then in regular decimal form to some degree of precision. Note now that this system had now become digital. (Sampling by itself does not make the representation digital; it only makes it discrete. If we left the samples just as voltages on some bus, the system would not be digital.) As a result, we have introduced an imperfection into our execution of the process, the fact that the numbers Adam writes do not precisely correspond to the voltage of the waveform at the sample instant. For example if he writes for one sample "0.986 (V)", the actual voltage of the waveform at that instant might be:
0.98587321641079226 . . . V.
Although this situation (the matter of "quantizing error") is of great concern in the design and performance of any digital system, it is not related to the actual topic of this note, so I will mostly ignore it from here on.
After Adam has done this for the span of "time" represented by the entire sheet of graph paper I gave him, he passes his log sheet to Becky, who will play the role of the "receiving" (or "playback") end of the system. It will be her task to (hopefully) reconstruct the entire original waveform from only the list of sample values on the log sheet.
Note that Becky knows the sample rate that was used at Adam's end.
She works on a sheet of graph paper such as we had at Adam's end. She draws vertical lines at intervals of 125 us. At each line, she placed a point whose height corresponds to the value on the log sheet of the sample at that instant.
To finish her work, Becky must now "draw a smooth curve" through these points. We would hope that this would be a duplicate of the original waveform (except for the small discrepancies caused by quantization).
But Becky could draw any number of "smooth" curves through that set of points. Which one should she draw?
Well, I instruct her to draw any curve she likes but that it must be one that contains (if we were to analyze it by Fourier analysis) only frequencies below 4000 Hz. That is because we know that indeed the original waveform (whose twin we seek to make her) did not contain any frequencies below 4000 Hz.
Now how could Becky actually follow this restriction? Well, this is just a story, so we will presume she somehow could. (Perhaps she is Cherokee, and her grandmother, of the fictional Fourier clan, taught her to do it.)
Well, it turns out that there is only one curve that passes through that set of points and contains only frequencies below 4000 Hz. And that is a precise and complete duplicate of the original waveform.
Wow!
In part 2 of this series, we will see how Becky's supernatural ability is actually performed in an electrical system. You will be astounded by how simple it is!
[to be continued]
If we capture the instantaneous voltage of a waveform (sample it) at regular intervals at a rate greater than twice the frequency of the highest-frequency component in the waveform, the sequence of sample values completely describes the waveform. As a consequence, from that sequence of sample values we can completely and precisely reconstruct the entire original waveform.
When we first hear this it may be hard to swallow. For example, how can the "reconstructing organ", even in theory, precisely determine what the voltage is at all the (infinite number of) points of the waveform between the sample points? Then, if we accept that this is theoretically possible, how can the "reconstructing organ" actually do that?
We will find that this story plays out well in the situation of a "signal" such as an electrical waveform (and audio waveform for example).
In a digital camera, we are also interested in completely describing a continuous "variable" through a finite number of samples. Here, the "variable" is the color of an image, which of course varies two-dimensionally across the image. The finite number of samples that we "deliver" are the colors of the pixels of the delivers digital image.
When we now look to find, in our overall digital chain, the equivalent of a certain critical feature of the reconstructing organ that we learned to appreciate in our work with an electrical waveform, we are unable to locate it. In fact, there is a a pivotal difference between the waveform and image cases (in actual practice) that influences how a digital system must be designed and how it will behave.
In this series of notes, I will take you through this story.
Reconstruction of a waveform from samples - a human simulation
I like to explain how reconstruction of a waveform can work through an exercise in which we simulate the workings of a sampled system using human actors.
The system being simulated seeks to transport electrical waveforms containing components at frequencies no higher than 3800 Hz. Aware of the "rules" of Messrs. Shannon and Nyquist, we will sample the waveform at a rate of 8000 samples per second (8000 Hz). That is, a sample will be taken every 125 us.
Adam will play the role of the "sending" (or perhaps "recording") end of the system. I give him the waveform to be processed as a curve drawn on graph paper. The horizontal axis represents time and the vertical axis voltage. I take care that this waveform would only contain frequency components below 4000 Hz, the Nyquist frequency" for our sampling rate of 8000 Hz. That is, if we were to analyze the waveform by Fourier analysis, we would find in it only components whose frequency was less than 4000 Hz.
Adam begins his work by drawing vertical lines on the graph paper at intervals of (according to the time scale) 125 us. These lines represent the sampling instants.
Adam then notes the points at which the waveform intersects these lines and records on his log sheet the voltages at each of those intersections. These are of course the sample values (which are in terms of voltage).
Hen writes then in regular decimal form to some degree of precision. Note now that this system had now become digital. (Sampling by itself does not make the representation digital; it only makes it discrete. If we left the samples just as voltages on some bus, the system would not be digital.) As a result, we have introduced an imperfection into our execution of the process, the fact that the numbers Adam writes do not precisely correspond to the voltage of the waveform at the sample instant. For example if he writes for one sample "0.986 (V)", the actual voltage of the waveform at that instant might be:
0.98587321641079226 . . . V.
Although this situation (the matter of "quantizing error") is of great concern in the design and performance of any digital system, it is not related to the actual topic of this note, so I will mostly ignore it from here on.
After Adam has done this for the span of "time" represented by the entire sheet of graph paper I gave him, he passes his log sheet to Becky, who will play the role of the "receiving" (or "playback") end of the system. It will be her task to (hopefully) reconstruct the entire original waveform from only the list of sample values on the log sheet.
Note that Becky knows the sample rate that was used at Adam's end.
She works on a sheet of graph paper such as we had at Adam's end. She draws vertical lines at intervals of 125 us. At each line, she placed a point whose height corresponds to the value on the log sheet of the sample at that instant.
To finish her work, Becky must now "draw a smooth curve" through these points. We would hope that this would be a duplicate of the original waveform (except for the small discrepancies caused by quantization).
But Becky could draw any number of "smooth" curves through that set of points. Which one should she draw?
Well, I instruct her to draw any curve she likes but that it must be one that contains (if we were to analyze it by Fourier analysis) only frequencies below 4000 Hz. That is because we know that indeed the original waveform (whose twin we seek to make her) did not contain any frequencies below 4000 Hz.
Now how could Becky actually follow this restriction? Well, this is just a story, so we will presume she somehow could. (Perhaps she is Cherokee, and her grandmother, of the fictional Fourier clan, taught her to do it.)
Well, it turns out that there is only one curve that passes through that set of points and contains only frequencies below 4000 Hz. And that is a precise and complete duplicate of the original waveform.
Wow!
In part 2 of this series, we will see how Becky's supernatural ability is actually performed in an electrical system. You will be astounded by how simple it is!
[to be continued]


