Doug Kerr
Well-known member
An interesting 2005 paper by researchers David Alleysson, Sabine Süsstrunk, and Jeanny Hérault gives me new insight into the color artifacts that may appear in the course of demosaicing with a CFA (color filter array) sensor camera.
The paper itself is here:
http://infoscience.epfl.ch/record/50200/files/ASH05.pdf?version=2
Their paper, in fact, proposes a "new" approach to demosaicing (I don't know whether it is incorporated in any demosaicing systems we encounter). But in any case the insights it gives are likely pertinent to any demosaicing scheme.
Briefly, the important fact is that the type of artifact of which we most often speak (usually described as "color moiré patterns") is a result of what we call, in analog color television work, "luminance-chrominance crosstalk".
My grasp of all the implications is quite incomplete, but nevertheless I thought I would attempt to pass on what I understand.
A CFA sensor is a special kind of "tristimulus" sensor, with photodetectors having three different spectral responses (identified, somewhat misleadingly, as "R", "G", and "B".)
The three sets of photodetectors "sample" the "R", "G", and "B" aspects of the image. but "sparsely"; that is, they do not take a sample at every location where we will want to have a pixel in the delivered image. The object of demosaicing is to make up for this shortcoming by, in effect, generating an estimated set of "R", "G", and "B" values for every pixel location.
Alleysson et al point out that the colors (approximately) captured by the tristimulus process can also be described in a luminance-chrominance way (as we eventually do in the sYCC representation used inside a JPEG image, or as in an NTSC color television signal).
The authors point out through some lovely mathematics that the luminance aspect of the color variation of the image can be rigorously determined from the total suite of "R", "G", and "B" photodetector outputs at a resolution that supports our ultimate pixel resolution. Said another way, the Nyquist frequency limit for the luminance aspect is that predicted on the pitch of the photodetectors (all of them, not, for example, the pitch between adjacent "R" photodetectors).
I will call the luminance "Y", even though it is not true luminance (that happens a lot!).
The authors then define a two-dimensional measure of the chrominance of a color, in terms of a "red" vs. "blue" axis and a "green" vs. "magenta" axis. I will call those coordinates "J" and "K" respectively.
The actual resolution of the J and K coordinates is lower than our ultimate pixel resolution, since the individual "aspects" are samples more coarsely. Nevertheless, even if there are no higher frequency components in the chrominance aspect of the variation of color in the image, in the actual structure of the set of sample values (prior to our applying a "reconstitution filter"), there are higher frequency components.
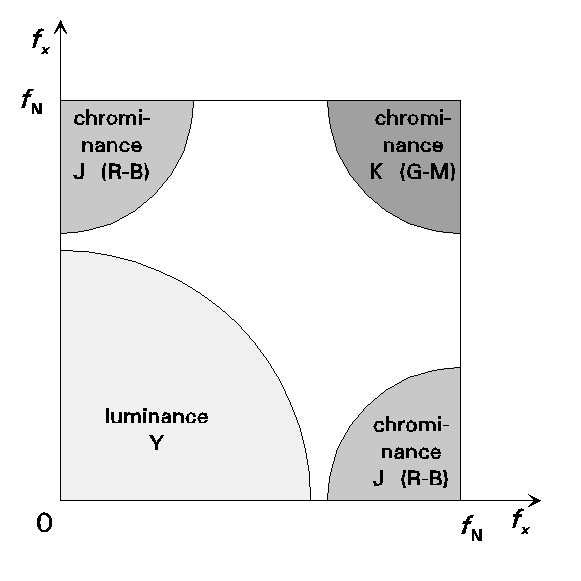
Now, the authors use a fascinating plot to show this, called a "Fourier domain plot". We see it here:

The two axes represent the frequencies contained in the suite of samples. There are two axes since the image is two-dimensional, and anything describing variations across it (or the results of capturing those variations) must have a an "x" and "y" axis.
The extremes of the plot correspond to the Nyquist frequency (that is, the one predicated on the pitch of all photodetectors).
Now, it turns out that the components of the luminance aspect of the suite of samples lie primarily in the region at the lower left.
The components of the "J" chrominance aspect of the suite of samples - the "red vs. blue" aspect - lie primarily in the regions at the upper left and lower right.
The components of the "K" chrominance aspect of the suite of samples - the "green vs. magenta" aspect - lie primarily in the regions at the upper left and lower right.
Wow! Who'd have thunk it!
Now, we can isolate the luminance components (Y), the J chrominance components, and the K luminance components from the overall picture painted by the set of detector values ("sample values") with three filters (each with varying responses based on the "direction" on the Nyquist domain plane). The outputs of these filters are "continuous" (that is, they don't have values at just the sample points for one or the other of the sets of photodetectors.
Since these filters work on a ensemble of values that are held in digital form, they are digital filters. Thus in fact their outputs are not truly continuous, but are themselves presented in the form of samples (at a rate sufficient to preserve all the necessary components in the filter output - the ghost of brother Nyquist is always hovering over our shoulders). In this case, the spacing of the samples is the output pixel pitch.
Now we resample the three outputs of these filters at the final pixel rate. Wait - I just said that their outputs already come as samples at that rate! Well, this step is then trivial - the outputs are already "resampled"!
We use those three ensembles of samples to represent the deliverable image at a resolution corresponding to its pixel structure. That is, we have recovered a pixel-resolution image (on a Y-J-K basis) by demosaicing (of a particular kind).
We can now transform the Y-J-K representation (sort of) to an sRGB representation for delivery.
Now, the pathology
Now suppose that, as seen on the figure above:
a. There were components of the calculated luminance whose frequencies lie outside the example region at the lower left, and/or
b. The filter we used to embrace the "J" chrominance components was too large, and actually embraced part of the luminance component ("Y") region.
Then we will have false color artifacts. Luminance components will improperly "report for duty" to be interpreted as chrominance components. This is the very same thing we often had in the early days of NTSC color television when an actor wore a gray suit with fine pin stripes, and in the delivered image was swaddled in a rainbow of color artifacts.
*****
Take a break while I get up, stretch, and kiss the cook.
[to be continued]
The paper itself is here:
http://infoscience.epfl.ch/record/50200/files/ASH05.pdf?version=2
Their paper, in fact, proposes a "new" approach to demosaicing (I don't know whether it is incorporated in any demosaicing systems we encounter). But in any case the insights it gives are likely pertinent to any demosaicing scheme.
Briefly, the important fact is that the type of artifact of which we most often speak (usually described as "color moiré patterns") is a result of what we call, in analog color television work, "luminance-chrominance crosstalk".
My grasp of all the implications is quite incomplete, but nevertheless I thought I would attempt to pass on what I understand.
A CFA sensor is a special kind of "tristimulus" sensor, with photodetectors having three different spectral responses (identified, somewhat misleadingly, as "R", "G", and "B".)
Note that the responses of three photodetectors all observing a region in the image of a certain color do not correspond to the R, G, and B coordinates of any RGB color model. An approximate transformation from one representation to the other is made in the final stages of image processing in the camera or raw developer. This has nothing to do with the point of this note, but can serve to confuse those trying to follow the action.
The three sets of photodetectors "sample" the "R", "G", and "B" aspects of the image. but "sparsely"; that is, they do not take a sample at every location where we will want to have a pixel in the delivered image. The object of demosaicing is to make up for this shortcoming by, in effect, generating an estimated set of "R", "G", and "B" values for every pixel location.
Alleysson et al point out that the colors (approximately) captured by the tristimulus process can also be described in a luminance-chrominance way (as we eventually do in the sYCC representation used inside a JPEG image, or as in an NTSC color television signal).
The authors point out through some lovely mathematics that the luminance aspect of the color variation of the image can be rigorously determined from the total suite of "R", "G", and "B" photodetector outputs at a resolution that supports our ultimate pixel resolution. Said another way, the Nyquist frequency limit for the luminance aspect is that predicted on the pitch of the photodetectors (all of them, not, for example, the pitch between adjacent "R" photodetectors).
This is, incidentally, really a "pseudo-luminance", not a true luminance as defined by rigorous colorimetric theory. But it plays the role well enough for our purposes.
I will call the luminance "Y", even though it is not true luminance (that happens a lot!).
The authors then define a two-dimensional measure of the chrominance of a color, in terms of a "red" vs. "blue" axis and a "green" vs. "magenta" axis. I will call those coordinates "J" and "K" respectively.
The actual resolution of the J and K coordinates is lower than our ultimate pixel resolution, since the individual "aspects" are samples more coarsely. Nevertheless, even if there are no higher frequency components in the chrominance aspect of the variation of color in the image, in the actual structure of the set of sample values (prior to our applying a "reconstitution filter"), there are higher frequency components.
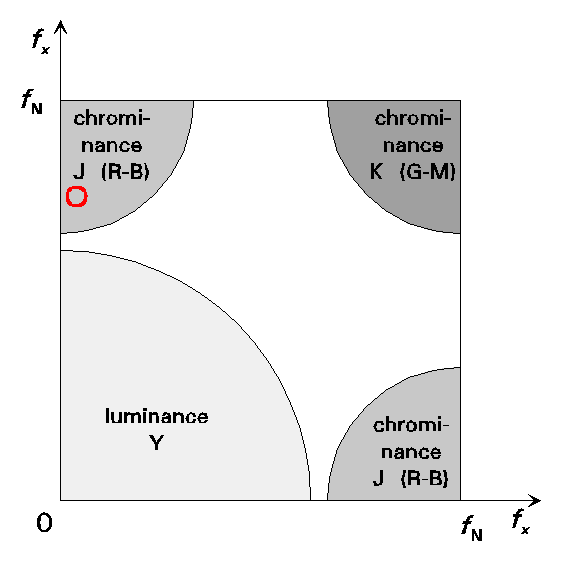
Now, the authors use a fascinating plot to show this, called a "Fourier domain plot". We see it here:

The two axes represent the frequencies contained in the suite of samples. There are two axes since the image is two-dimensional, and anything describing variations across it (or the results of capturing those variations) must have a an "x" and "y" axis.
The extremes of the plot correspond to the Nyquist frequency (that is, the one predicated on the pitch of all photodetectors).
Now, it turns out that the components of the luminance aspect of the suite of samples lie primarily in the region at the lower left.
The components of the "J" chrominance aspect of the suite of samples - the "red vs. blue" aspect - lie primarily in the regions at the upper left and lower right.
The components of the "K" chrominance aspect of the suite of samples - the "green vs. magenta" aspect - lie primarily in the regions at the upper left and lower right.
Wow! Who'd have thunk it!
Now, we can isolate the luminance components (Y), the J chrominance components, and the K luminance components from the overall picture painted by the set of detector values ("sample values") with three filters (each with varying responses based on the "direction" on the Nyquist domain plane). The outputs of these filters are "continuous" (that is, they don't have values at just the sample points for one or the other of the sets of photodetectors.
Since these filters work on a ensemble of values that are held in digital form, they are digital filters. Thus in fact their outputs are not truly continuous, but are themselves presented in the form of samples (at a rate sufficient to preserve all the necessary components in the filter output - the ghost of brother Nyquist is always hovering over our shoulders). In this case, the spacing of the samples is the output pixel pitch.
Now we resample the three outputs of these filters at the final pixel rate. Wait - I just said that their outputs already come as samples at that rate! Well, this step is then trivial - the outputs are already "resampled"!
We use those three ensembles of samples to represent the deliverable image at a resolution corresponding to its pixel structure. That is, we have recovered a pixel-resolution image (on a Y-J-K basis) by demosaicing (of a particular kind).
We can now transform the Y-J-K representation (sort of) to an sRGB representation for delivery.
Now, the pathology
Now suppose that, as seen on the figure above:
a. There were components of the calculated luminance whose frequencies lie outside the example region at the lower left, and/or
b. The filter we used to embrace the "J" chrominance components was too large, and actually embraced part of the luminance component ("Y") region.
Then we will have false color artifacts. Luminance components will improperly "report for duty" to be interpreted as chrominance components. This is the very same thing we often had in the early days of NTSC color television when an actor wore a gray suit with fine pin stripes, and in the delivered image was swaddled in a rainbow of color artifacts.
*****
Take a break while I get up, stretch, and kiss the cook.
[to be continued]


