
Doug Kerr
Well-known member
Various suites of text images, intended for testing or adjusting display chains without benefit of an actual colorimeter, include a clever way to visually ascertain the gamma of the display chain.
A nice example if found in the Lacom monitor test suite, developed by Han-Kwang Nienhuys. (Thanks to Maggie for calling this to our attention.)
That test suite can be accessed here:
http://www.lagom.nl/lcd-test/
Nienhuys asked the we not link to his images, but I will take the liberty of doing so here in order to describe how this test works.
Here we see the gamma test image:
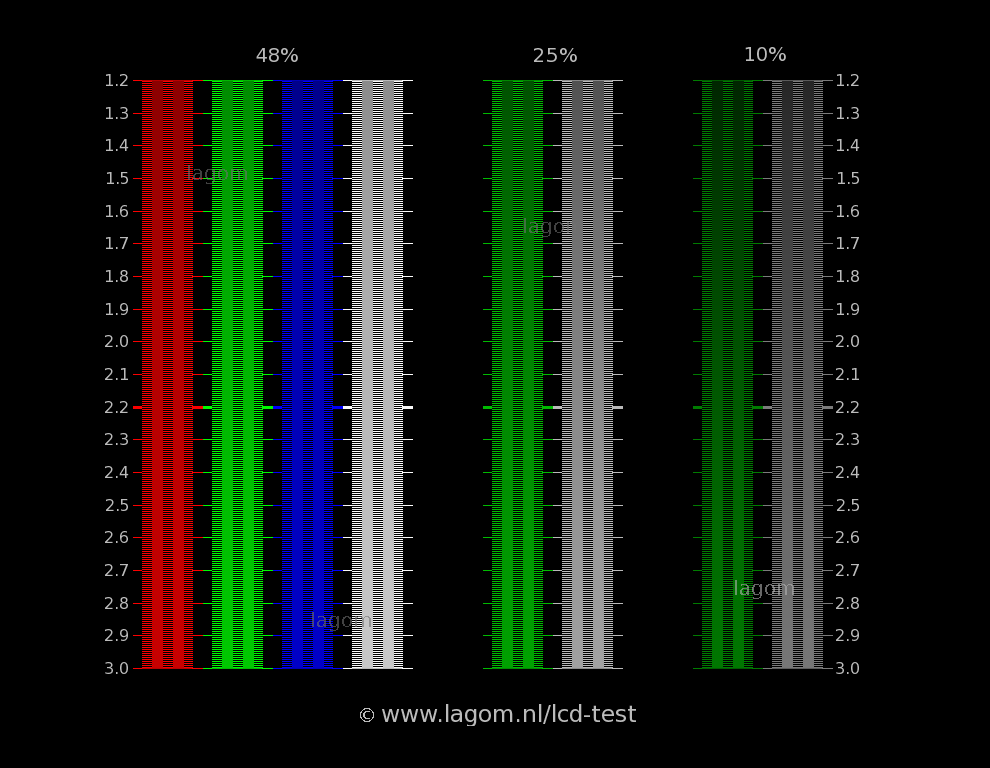
Consider first the left-hand panel ("48%" - I'll explain later what that means), and the "gray" set of bands in it.
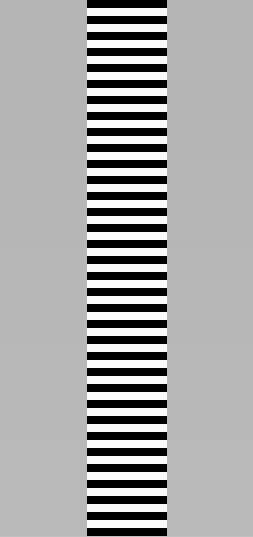
The principle is that if we observe this from a distance such that the little alternating "zebra stripes" of the outside and center bands blur into a solid gray band, and note the point at which these bands appear to have the same luminance as the interspersed "solid" gray bands, then the height at which that appears (read from the numerical scale) gives us an indication of the gamma of the display chain.
How does that work?
Well, first note that the RGB color of the solid gray bands varies steadily as we go from top (RGB 139) to bottom (RGB 200).
We also note that in the central and outside bands, the RGB color of the dark stripes is always 0, and of the lighter stripes, always 250. (Again, this is for the "48%" panel.)
Now suppose that the display chain actually follows the sRGB transfer curve specification. If so, the relative luminance of the dark stripes (RGB 0) should be 0, and the relative luminance of the lighter stripes (RGB 250) should be 0.956.
If we see this so that all the stripes blur together, we think we see a band of uniform luminance, that being the average luminance of the dark and light stripes (since they are of the same width). That average (relative) luminance should be 0.478.
Again assuming that the display chain follows the sRGB specification, that would be very nearly the luminance that should be exhibited for RGB 184. Thus we might expect that "striped" and "solid" bands to nearly match in apparent luminance where the color of the solid band is RGB 184.
And that range of RGB is centered at about 2.5 on the gamma scale. So this test would tell us that the gamma of our display chain was about 2.5.
Is that the correct gamma for an sRGB display chain?
Well, now we need to get into a complication. The sRGB transfer curve does not follow a simple power law with a certain exponent (gamma). Rather, it has a linear portion near the origin (for small luminance values), followed by a portion that follows a power law, with exponent 2.4, but offset (so as to nicely join the linear portion).
Thus there is no gamma for the sRGB curve (although it can be handily approximated by a power curve with an exponent of 2.2).
What we can do is one of two things:
A. We can, at any point on the sRGB transfer curve, speak of the gamma of a power curve that would have the same slope as the sRGB curve for that luminance.
B. We can, at any point on the sRGB transfer curve, speak of the gamma of a power curve that would have the same RGB value as the sRGB curve for that luminance.
The Lacom test evidently reports on the latter basis (B).
And so of course (in either case, actually) we would get a different result in different portions of the curve. Thus the three panels in the Lacom test image. The first panel ("48%"), for a perfect match to the sRGB transfer curve, would give the visual match at a relative luminance of almost exactly 48%. It in effect gives us the gamma of the chain, in sense "B", at a luminance of 48%. (Actually, it is only at exactly that luminance if the response indeed matches the sRGB curve!)
The second and third panels test for the gamma (in sense "B") at luminances of about 25% and 10%.
Nienhuys tells us that the expected values of gamma for the sRGB curve (in sense "B") are as follows at the different luminance (Y) values:
Y gamma
10% 2.17
25% 2.20
48% 2.25
The discrepancy from my earlier analysis is probably due to my having rounded the apparent color of the striped band to an integral RGB value.
Does it work?
Well, when I view the test image (as downloaded from the Lacom site) on my system by way of a trusted viewer, the gamma values it indicates comport well with the result from measurements with the Spyder3 system.
On the other hand, if I view the file "online" with my browser (Firefox 30), the results are quite different. This may well be a result of some inappropriate setting in my browser regarding assumed color space or such (I find that all very confusing).
I will look into that when I have a chance.
Best regards,
Doug
A nice example if found in the Lacom monitor test suite, developed by Han-Kwang Nienhuys. (Thanks to Maggie for calling this to our attention.)
That test suite can be accessed here:
http://www.lagom.nl/lcd-test/
Nienhuys asked the we not link to his images, but I will take the liberty of doing so here in order to describe how this test works.
Here we see the gamma test image:
Consider first the left-hand panel ("48%" - I'll explain later what that means), and the "gray" set of bands in it.
The principle is that if we observe this from a distance such that the little alternating "zebra stripes" of the outside and center bands blur into a solid gray band, and note the point at which these bands appear to have the same luminance as the interspersed "solid" gray bands, then the height at which that appears (read from the numerical scale) gives us an indication of the gamma of the display chain.
How does that work?
Well, first note that the RGB color of the solid gray bands varies steadily as we go from top (RGB 139) to bottom (RGB 200).
We also note that in the central and outside bands, the RGB color of the dark stripes is always 0, and of the lighter stripes, always 250. (Again, this is for the "48%" panel.)
Now suppose that the display chain actually follows the sRGB transfer curve specification. If so, the relative luminance of the dark stripes (RGB 0) should be 0, and the relative luminance of the lighter stripes (RGB 250) should be 0.956.
If we see this so that all the stripes blur together, we think we see a band of uniform luminance, that being the average luminance of the dark and light stripes (since they are of the same width). That average (relative) luminance should be 0.478.
Again assuming that the display chain follows the sRGB specification, that would be very nearly the luminance that should be exhibited for RGB 184. Thus we might expect that "striped" and "solid" bands to nearly match in apparent luminance where the color of the solid band is RGB 184.
And that range of RGB is centered at about 2.5 on the gamma scale. So this test would tell us that the gamma of our display chain was about 2.5.
Is that the correct gamma for an sRGB display chain?
Well, now we need to get into a complication. The sRGB transfer curve does not follow a simple power law with a certain exponent (gamma). Rather, it has a linear portion near the origin (for small luminance values), followed by a portion that follows a power law, with exponent 2.4, but offset (so as to nicely join the linear portion).
Thus there is no gamma for the sRGB curve (although it can be handily approximated by a power curve with an exponent of 2.2).
What we can do is one of two things:
A. We can, at any point on the sRGB transfer curve, speak of the gamma of a power curve that would have the same slope as the sRGB curve for that luminance.
B. We can, at any point on the sRGB transfer curve, speak of the gamma of a power curve that would have the same RGB value as the sRGB curve for that luminance.
The Lacom test evidently reports on the latter basis (B).
And so of course (in either case, actually) we would get a different result in different portions of the curve. Thus the three panels in the Lacom test image. The first panel ("48%"), for a perfect match to the sRGB transfer curve, would give the visual match at a relative luminance of almost exactly 48%. It in effect gives us the gamma of the chain, in sense "B", at a luminance of 48%. (Actually, it is only at exactly that luminance if the response indeed matches the sRGB curve!)
The second and third panels test for the gamma (in sense "B") at luminances of about 25% and 10%.
Nienhuys tells us that the expected values of gamma for the sRGB curve (in sense "B") are as follows at the different luminance (Y) values:
Y gamma
10% 2.17
25% 2.20
48% 2.25
The discrepancy from my earlier analysis is probably due to my having rounded the apparent color of the striped band to an integral RGB value.
Does it work?
Well, when I view the test image (as downloaded from the Lacom site) on my system by way of a trusted viewer, the gamma values it indicates comport well with the result from measurements with the Spyder3 system.
On the other hand, if I view the file "online" with my browser (Firefox 30), the results are quite different. This may well be a result of some inappropriate setting in my browser regarding assumed color space or such (I find that all very confusing).
I will look into that when I have a chance.
Best regards,
Doug
")